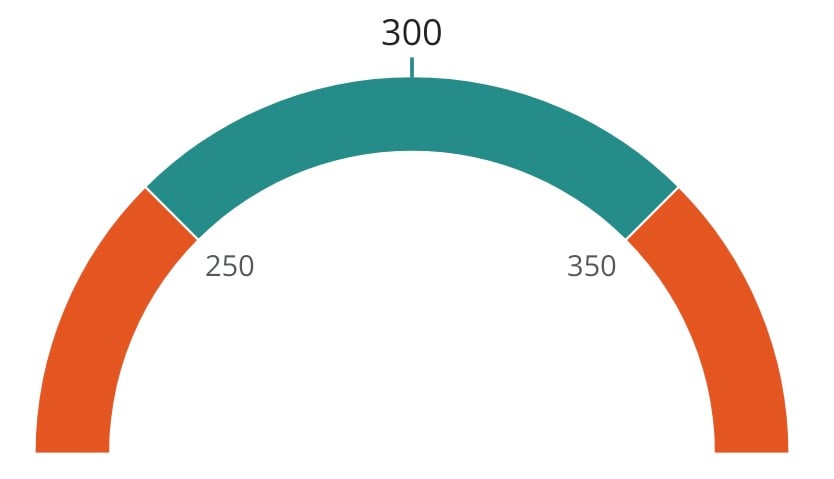
 ## Powering In Range Gauge
The In Range Gauge requires you to set the **Current Value, Lower range value,** and **Upper range value** for the chart. You must ensure that each of these values is numerical. Configure the values as follows:
* The **Current Value** needs to be either a DataSet with a singular value or an aggregated field from the DataSet, such as performing a SUM on the value.
* The **Lower range value** needs to be a smaller value/field from your DataSet than the **Upper range value**. Your current value displays either within or outside of the lower and upper range values depending on your data.
## Powering In Range Gauge
The In Range Gauge requires you to set the **Current Value, Lower range value,** and **Upper range value** for the chart. You must ensure that each of these values is numerical. Configure the values as follows:
* The **Current Value** needs to be either a DataSet with a singular value or an aggregated field from the DataSet, such as performing a SUM on the value.
* The **Lower range value** needs to be a smaller value/field from your DataSet than the **Upper range value**. Your current value displays either within or outside of the lower and upper range values depending on your data.
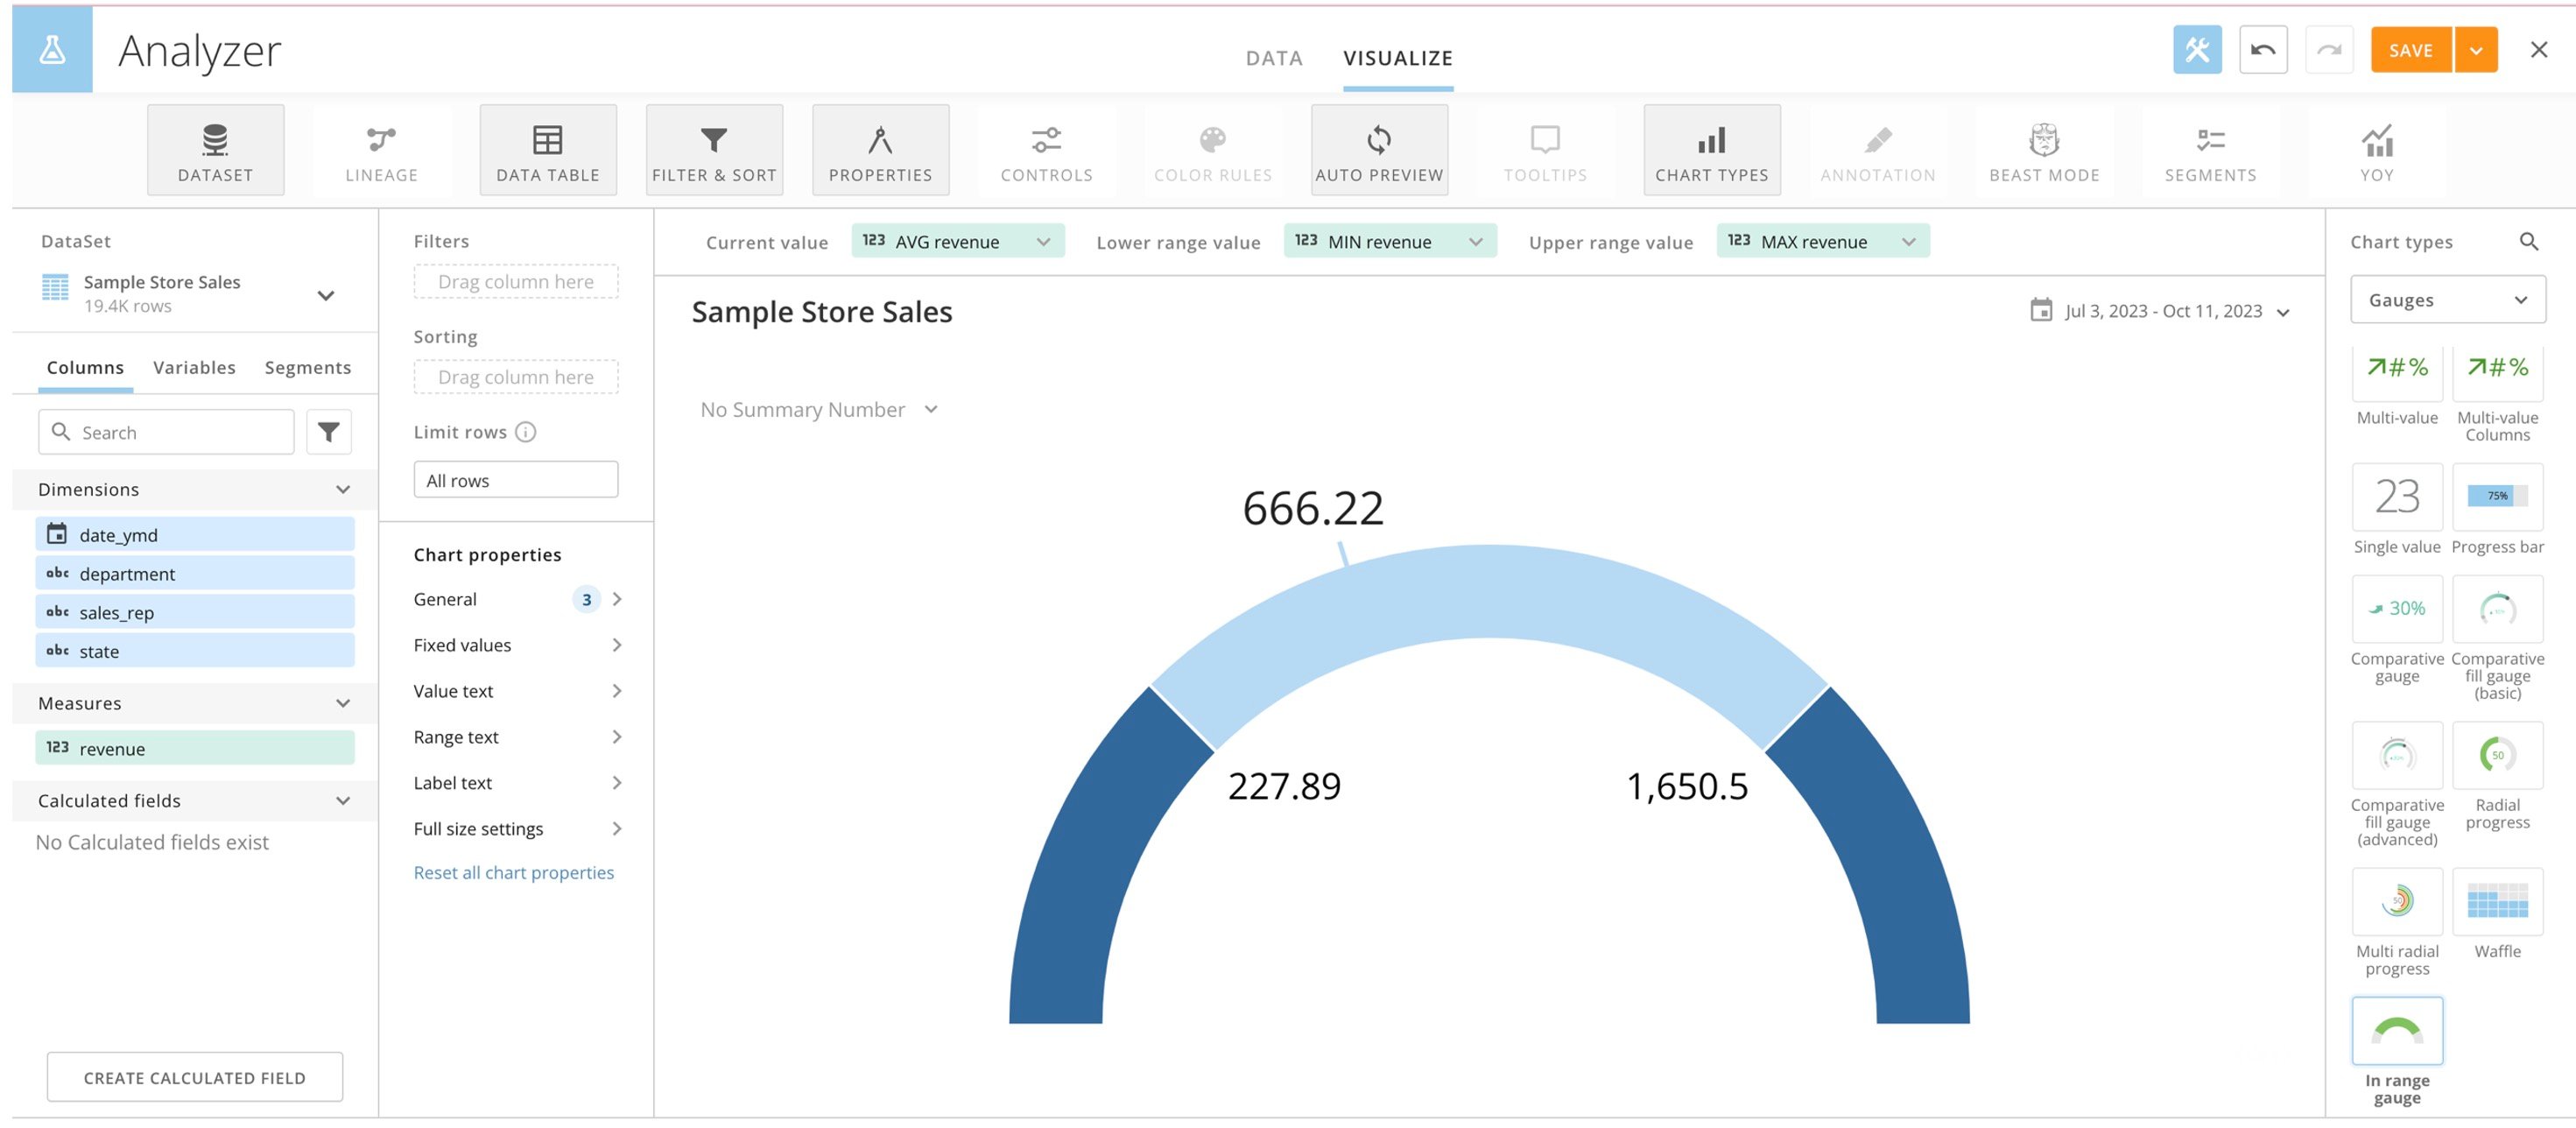 ## Customizing In Range Gauge
You can customize the appearance of an In Range Gauge by editing its **Chart Properties**.
Chart properties are available in the following categories. The table lists the unique properties of an In Range Gauge.
* General — Learn about
[Width percent](/s/article/360042924934) and [Label text](/s/article/4546361976087).
* Fixed values
* Text
* Full size — Learn about [Full size properties](/s/article/360043429793#full-size-settings).
## Customizing In Range Gauge
You can customize the appearance of an In Range Gauge by editing its **Chart Properties**.
Chart properties are available in the following categories. The table lists the unique properties of an In Range Gauge.
* General — Learn about
[Width percent](/s/article/360042924934) and [Label text](/s/article/4546361976087).
* Fixed values
* Text
* Full size — Learn about [Full size properties](/s/article/360043429793#full-size-settings).
Property
Description
Example
General > Gauge style
Sets the style of the gauge to be displayed: Default, Arc, or Linear.
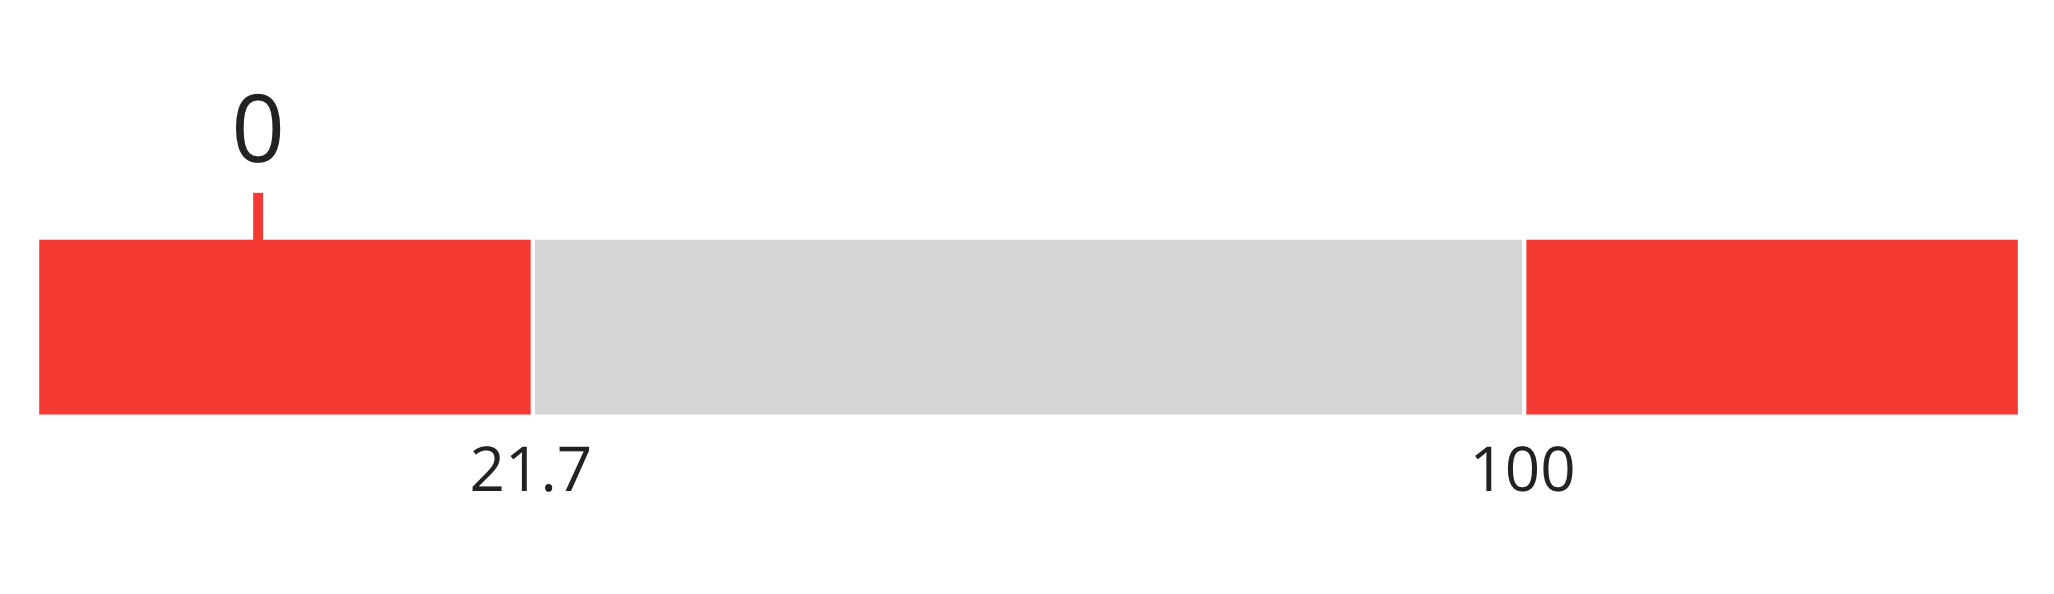
General > In range color
Sets the color displayed when the gauge value is in range.
—
General > Default color
Sets the color displayed on the gauge outside of the highlighted area.
—
General > Out of range color
Sets the color displayed when the gauge value is out of range.
General > Hide range values
When set, the range values are not displayed on the range.
General > Auto abbreviate value
When set, the value is abbreviated if over 1,000.00.
General > Auto abbreviate range values
When set, the range values are abbreviated if over 1,000.00
Fixed values > Lower range value
Sets a fixed lower range value if not specified by a column of data.
Fixed values > Upper range value
Sets a fixed upper range value if not specified by a column of data.
—
Text > Value font size
Sets the font size for the value text of the gauge: Default, XXX-Large, XX-Large, X-Large, Large, Medium – Large, Medium, Medium – Small, Small, X-Small, or XX-Small
—
Text > Range font size
Sets the font size for the range text of the gauge: Default, XXX-Large, XX-Large, X-Large, Large, Medium – Large, Medium, Medium – Small, Small, X-Small, or XX-Small
—
Text > Label font size
Sets the font size for the label text of the gauge: Default, XXX-Large, XX-Large, X-Large, Large, Medium – Large, Medium, Medium – Small, Small, X-Small, or XX-Small
—