> ## Documentation Index
> Fetch the complete documentation index at: https://domoinc-bradley-turek-pfilter-operators-reference.mintlify.site/llms.txt
> Use this file to discover all available pages before exploring further.
# Magic ETL Tiles: AI Services
export const BetaNote = ({generic = false}) =>
Note:{" "}
{generic ? "" : "This feature is in beta. "}
Beta Program participants can enable features{" "}
here. To join the
Beta Program, fill out{" "}
this form. For beta
questions or feedback, email{" "}
beta.admin@domo.com.
;
## Intro
This article describes how to use the AI Services tiles in Magic ETL.
To learn how to use tiles in DataFlows, see [Create a Magic ETL DataFlow](/s/article/360055259234).
 ***
## AI Forecasting Tile
***
## AI Forecasting Tile
 The AI Forecasting tile allows you to predict future data points based on patterns or trends in your data by leveraging Domo's Forecasting Universal Model. After saving your forecast in an output DataSet, you can view the DataSet in Analyzer to visualize your forecast in a Forecasting Chart.
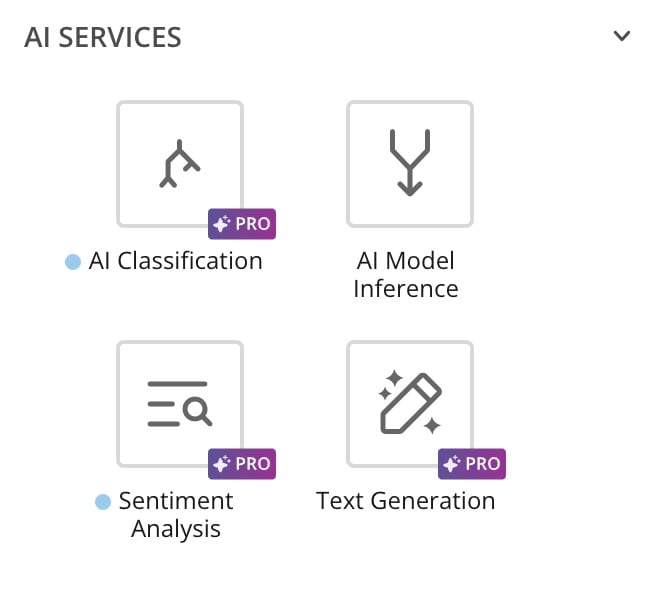
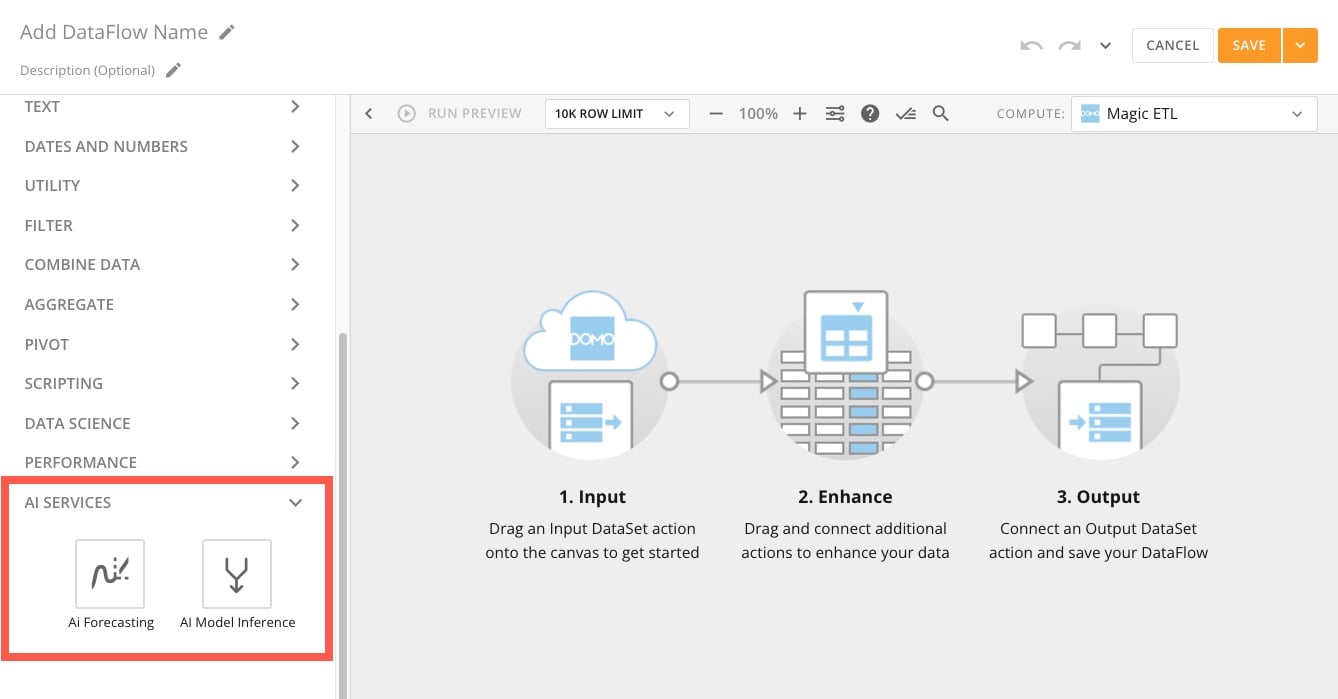
Access the AI Forecasting tile under **AI Services** in the Magic ETL interface.
The AI Forecasting tile allows you to predict future data points based on patterns or trends in your data by leveraging Domo's Forecasting Universal Model. After saving your forecast in an output DataSet, you can view the DataSet in Analyzer to visualize your forecast in a Forecasting Chart.
Access the AI Forecasting tile under **AI Services** in the Magic ETL interface.
 ### Configure the AI Forecasting Tile
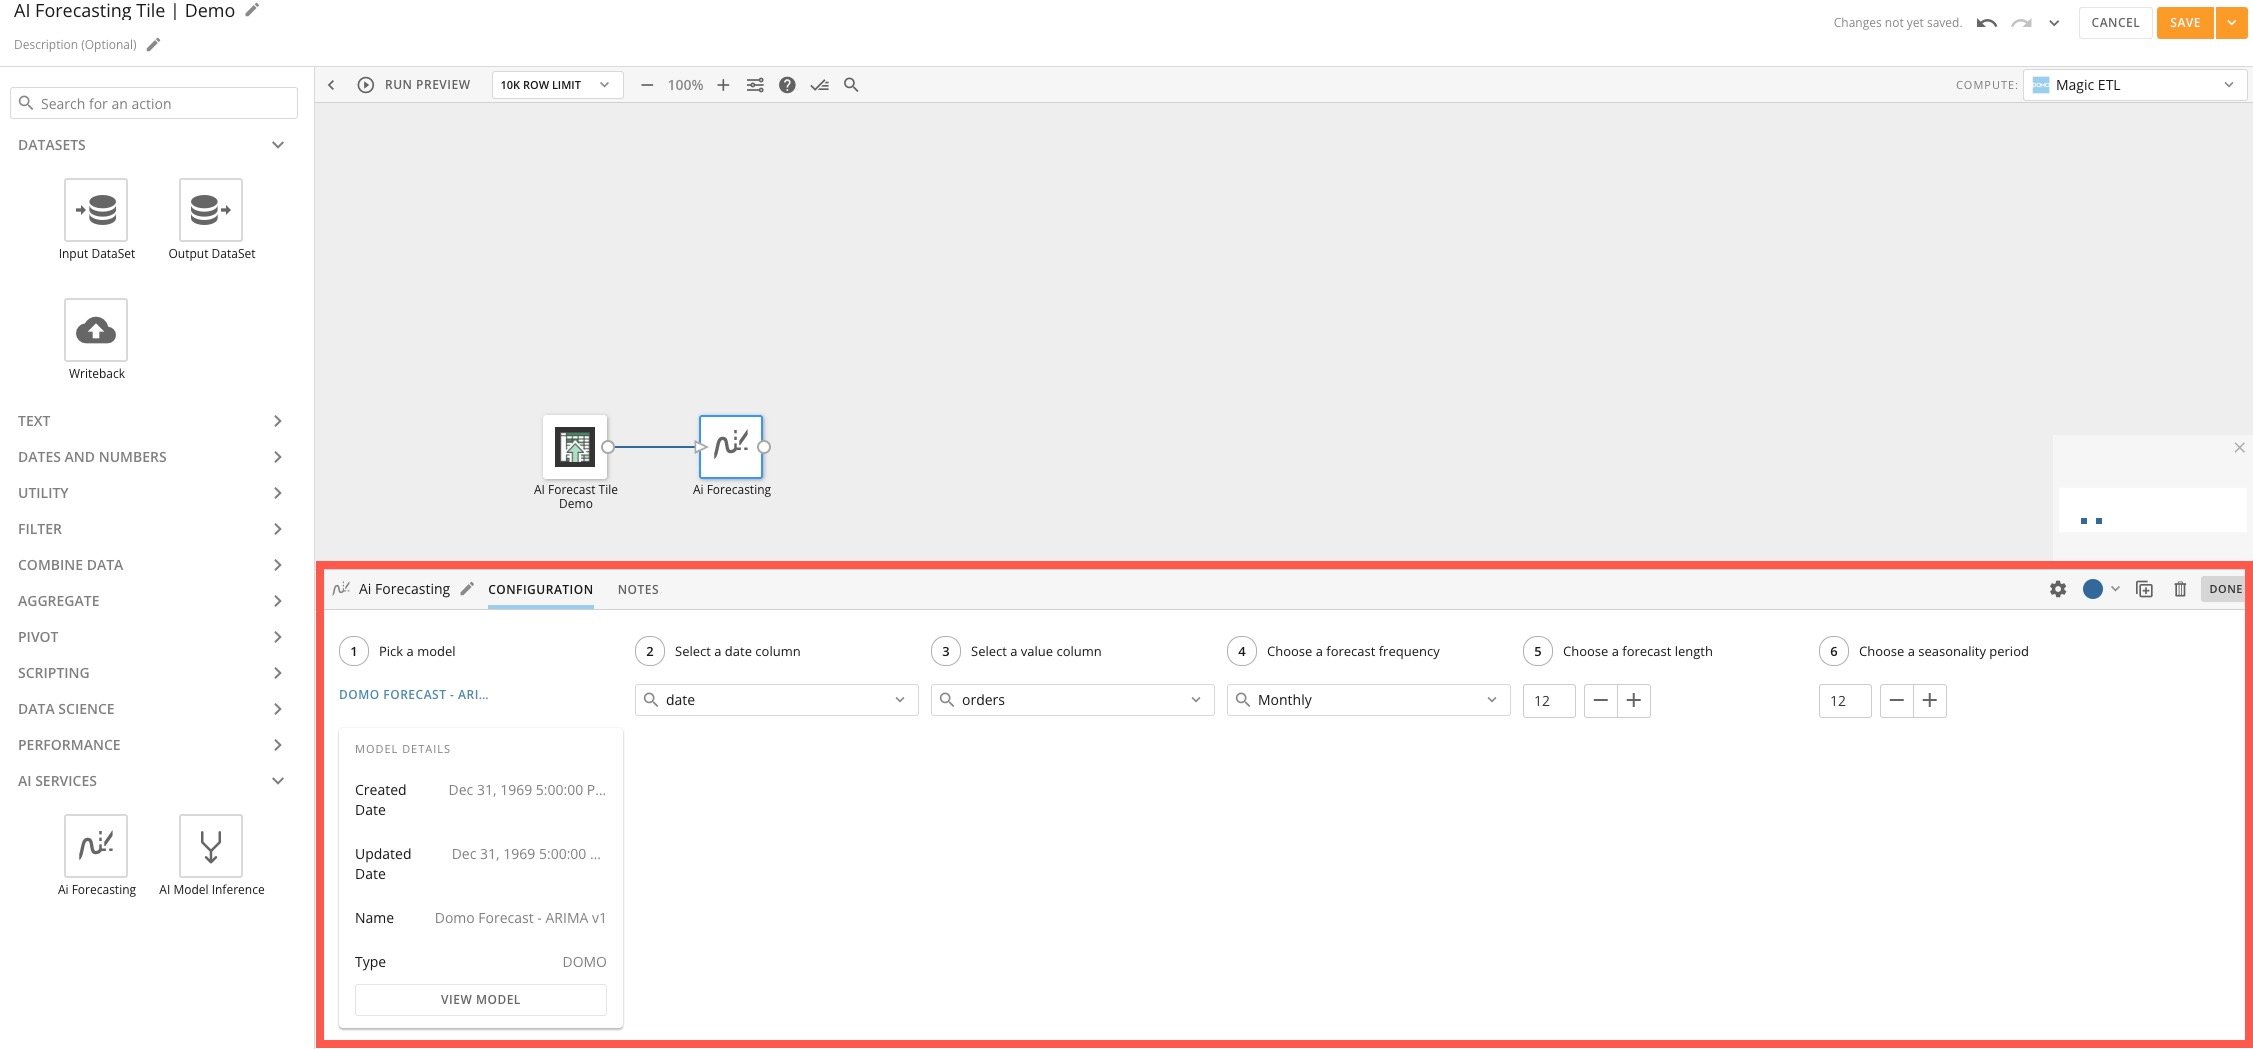
After you connect your input DataSet to an AI Forecasting tile on the Magic ETL canvas, you can configure your model preferences.
Select the AI Forecasting tile to expand the tile editor. Complete the steps in the editor.
### Configure the AI Forecasting Tile
After you connect your input DataSet to an AI Forecasting tile on the Magic ETL canvas, you can configure your model preferences.
Select the AI Forecasting tile to expand the tile editor. Complete the steps in the editor.
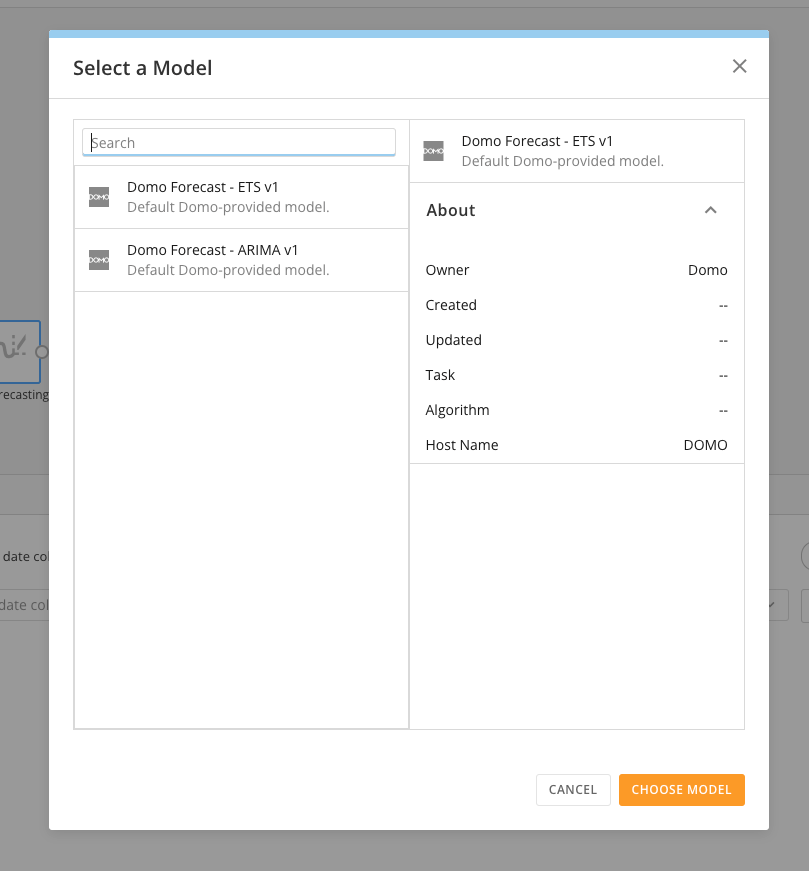
 First, choose a model. You can select the Domo ETS Forecasting Univeral Model or the Domo ARIMA Forecasting Universal Model.\
Learn more about [models](/s/article/000005502).
First, choose a model. You can select the Domo ETS Forecasting Univeral Model or the Domo ARIMA Forecasting Universal Model.\
Learn more about [models](/s/article/000005502).
 After choosing the model, complete the other steps in the tile editor. This table describes how.
| Settings | Description | Recommendations |
| ------------------ | ----------------------------------------------------------------------------------------------------------------------------------------------------------------------------------------------------------------------------------------------------------------------------------------------------------------------------------------------------------------------------------------------------------------------------------------------------------------------------------------------------------------------------- | ---------------------------------------------------------------------------------------------------------------------------------------------------------------------------------------------------------------------------------------------------------------------------------------------------------------------------------------------------------------------------------------------------------------------------------------------------------------------------------------------------------------------------------------------------------------------------------------------------------------------------------------------------------------------------------------------------------------------------------------------------------------------------------------------------------------------------------------------------------------------------------------------------------------------------------------------------------------------------------------------------------------------------------------------------------------------------------------------------------------------------------------------------------------------------------------------------------------------------------------------------------------------------------------------------------------------------------------------------------------------------------------------------------------------------------------------------------------------------------------------------------------------------------------------------------------------------------------------------------------------------------------------------------------------------------------------------------- |
| Date Column | Select the date column that identifies the date interval corresponding to each row in your DataSet. Values in this column must be stored as a date or time-stamp data type and must also be at the daily, weekly, monthly, quarterly, or yearly granularity level. If you have selected a DataSource, all available data columns with date or time-stamp data types are listed. | — |
| Value Column | Select the numeric column of data to forecast. Values in this column must be stored as an integer, floating decimal, or fixed decimal data type. If you have selected a DataSource, all available numeric data columns that are an integer, floating decimal, or fixed decimal data type are listed. | — |
| Frequency | Select the time-frequency to forecast. | — |
| Forecast Length | Select or input the number of time intervals you want to forecast.For example, if you select the **Day**option for the **Frequency**setting and want to receive a forecast for the next two weeks, enter 14 for the Forecast Length. The number you input should be an integer (whole number, no decimals) that is greater than or equal to 1. | — |
| Seasonality Period | Input the number of seasonality periods you would like the forecast to take into consideration. The input should be an integer (whole number, no decimals) that is greater than or equal to one. Seasonality refers to a repeating pattern that occurs in your data at a fixed frequency (ex., every hour, day, week, or month). For example, if you have daily sales data and tend to observe higher sales on weekdays than weekends, your data exhibits weekly seasonality and should set your Seasonality Period to seven. | - **Daily Data** - Weekly seasonality (a reoccurring pattern for every seven days): set your seasonality period to 7. - Monthly seasonality (reoccurring pattern every thirty days): set your seasonality period to 30. - Annual seasonality (reoccurring pattern every 365 days): set your seasonality period to 365. - For no seasonality, set the period to 1. - The seasonality period is set to 7 if the Frequency = Day. - **Weekly Data** - Weekly seasonality (a reoccurring pattern every four weeks): set your seasonality period to 4. - Quarterly seasonality (a reoccurring pattern every thirteen weeks): set your seasonality period to 13. - Annual seasonality (a reoccurring pattern every fifty-two weeks): set your seasonality period to 52. - For no seasonality, set the period to 1. - The seasonality period is set to 1 if the Frequency = Week. - **Monthly Data** - Quarterly seasonality (a reoccurring pattern every three months): set your seasonality period to 3. - Annual seasonality (a reoccurring pattern every twelve months): set your seasonality period to 12. - For no seasonality, set the period to 1. - The seasonality period is set to 12 if the Frequency = Day. - **Quarterly Data** - Annual seasonality (a reoccurring pattern every four quarters): set the seasonality period to 4. - For no seasonality, set the period to 1. - The seasonality period is set to 4 if the Frequency = Quarterly. - **Yearly Data** - If your data exhibits a reoccurring pattern every X years (such as 1, 2, 3..., set the seasonality period to X. - For no seasonality, set the period to one. - The seasonality period is set to one if the Frequency = Yearly. |
After configuring the AI Forecasting tile, finish configuring your Magic ETL DataFlow and create the output Dataset.
**Note:** The number of rows in your output DataSet depends on the number of
data points you configured to be forecasted.
The output DataSet includes seven columns. This table provides more information about them.
| Column | Description | Example |
| --------------- | ----------------------------------------------------------------------------------------------------------------------------------------------------------------------------------- | ------- |
| forecast\_value | This column includes the forecasted values. | — |
| confidence\_0 | The type of confidence interval built. | 80% |
| confidence\_1 | | |
| lower\_0 | The lower range of your confidence interval. The columns depend on the associated confidence interval. For example, `lower\_0` is the lower range for the `confidence\_0` interval. | — |
| lower\_1 | | |
| upper\_0 | The upper range of your confidence interval. The columns depend on the associated confidence interval. For example, `upper\_0` is the upper range for the `confidence\_0` interval. | — |
| upper\_1 | | |
#### Configure Your AI Forecasting Tile to Match Its Input Granularity
Drag and drop an **AI Forecasting** tile onto the authoring canvas and connect to your DataFlow.
Select the **AI Forecasting** tile to expand the tile editor.
Select **Configuration** (tab).
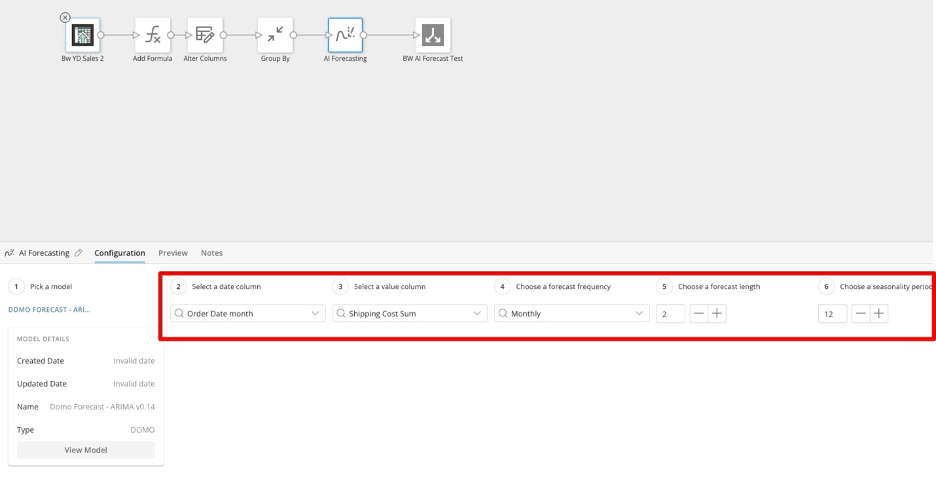
Adjust your date and value columns, then choose a forecast frequency and length, and select a seasonality period—all according to your specified granularity.\
For example, if you are ordering granularity by month, you can select your configured column “Order Date Month,” a value sum, a “Monthly” frequency, and a seasonality period of "12."
After choosing the model, complete the other steps in the tile editor. This table describes how.
| Settings | Description | Recommendations |
| ------------------ | ----------------------------------------------------------------------------------------------------------------------------------------------------------------------------------------------------------------------------------------------------------------------------------------------------------------------------------------------------------------------------------------------------------------------------------------------------------------------------------------------------------------------------- | ---------------------------------------------------------------------------------------------------------------------------------------------------------------------------------------------------------------------------------------------------------------------------------------------------------------------------------------------------------------------------------------------------------------------------------------------------------------------------------------------------------------------------------------------------------------------------------------------------------------------------------------------------------------------------------------------------------------------------------------------------------------------------------------------------------------------------------------------------------------------------------------------------------------------------------------------------------------------------------------------------------------------------------------------------------------------------------------------------------------------------------------------------------------------------------------------------------------------------------------------------------------------------------------------------------------------------------------------------------------------------------------------------------------------------------------------------------------------------------------------------------------------------------------------------------------------------------------------------------------------------------------------------------------------------------------------------------- |
| Date Column | Select the date column that identifies the date interval corresponding to each row in your DataSet. Values in this column must be stored as a date or time-stamp data type and must also be at the daily, weekly, monthly, quarterly, or yearly granularity level. If you have selected a DataSource, all available data columns with date or time-stamp data types are listed. | — |
| Value Column | Select the numeric column of data to forecast. Values in this column must be stored as an integer, floating decimal, or fixed decimal data type. If you have selected a DataSource, all available numeric data columns that are an integer, floating decimal, or fixed decimal data type are listed. | — |
| Frequency | Select the time-frequency to forecast. | — |
| Forecast Length | Select or input the number of time intervals you want to forecast.For example, if you select the **Day**option for the **Frequency**setting and want to receive a forecast for the next two weeks, enter 14 for the Forecast Length. The number you input should be an integer (whole number, no decimals) that is greater than or equal to 1. | — |
| Seasonality Period | Input the number of seasonality periods you would like the forecast to take into consideration. The input should be an integer (whole number, no decimals) that is greater than or equal to one. Seasonality refers to a repeating pattern that occurs in your data at a fixed frequency (ex., every hour, day, week, or month). For example, if you have daily sales data and tend to observe higher sales on weekdays than weekends, your data exhibits weekly seasonality and should set your Seasonality Period to seven. | - **Daily Data** - Weekly seasonality (a reoccurring pattern for every seven days): set your seasonality period to 7. - Monthly seasonality (reoccurring pattern every thirty days): set your seasonality period to 30. - Annual seasonality (reoccurring pattern every 365 days): set your seasonality period to 365. - For no seasonality, set the period to 1. - The seasonality period is set to 7 if the Frequency = Day. - **Weekly Data** - Weekly seasonality (a reoccurring pattern every four weeks): set your seasonality period to 4. - Quarterly seasonality (a reoccurring pattern every thirteen weeks): set your seasonality period to 13. - Annual seasonality (a reoccurring pattern every fifty-two weeks): set your seasonality period to 52. - For no seasonality, set the period to 1. - The seasonality period is set to 1 if the Frequency = Week. - **Monthly Data** - Quarterly seasonality (a reoccurring pattern every three months): set your seasonality period to 3. - Annual seasonality (a reoccurring pattern every twelve months): set your seasonality period to 12. - For no seasonality, set the period to 1. - The seasonality period is set to 12 if the Frequency = Day. - **Quarterly Data** - Annual seasonality (a reoccurring pattern every four quarters): set the seasonality period to 4. - For no seasonality, set the period to 1. - The seasonality period is set to 4 if the Frequency = Quarterly. - **Yearly Data** - If your data exhibits a reoccurring pattern every X years (such as 1, 2, 3..., set the seasonality period to X. - For no seasonality, set the period to one. - The seasonality period is set to one if the Frequency = Yearly. |
After configuring the AI Forecasting tile, finish configuring your Magic ETL DataFlow and create the output Dataset.
**Note:** The number of rows in your output DataSet depends on the number of
data points you configured to be forecasted.
The output DataSet includes seven columns. This table provides more information about them.
| Column | Description | Example |
| --------------- | ----------------------------------------------------------------------------------------------------------------------------------------------------------------------------------- | ------- |
| forecast\_value | This column includes the forecasted values. | — |
| confidence\_0 | The type of confidence interval built. | 80% |
| confidence\_1 | | |
| lower\_0 | The lower range of your confidence interval. The columns depend on the associated confidence interval. For example, `lower\_0` is the lower range for the `confidence\_0` interval. | — |
| lower\_1 | | |
| upper\_0 | The upper range of your confidence interval. The columns depend on the associated confidence interval. For example, `upper\_0` is the upper range for the `confidence\_0` interval. | — |
| upper\_1 | | |
#### Configure Your AI Forecasting Tile to Match Its Input Granularity
Drag and drop an **AI Forecasting** tile onto the authoring canvas and connect to your DataFlow.
Select the **AI Forecasting** tile to expand the tile editor.
Select **Configuration** (tab).
Adjust your date and value columns, then choose a forecast frequency and length, and select a seasonality period—all according to your specified granularity.\
For example, if you are ordering granularity by month, you can select your configured column “Order Date Month,” a value sum, a “Monthly” frequency, and a seasonality period of "12."
 ### Interpret Results from the AI Forecasting Tile
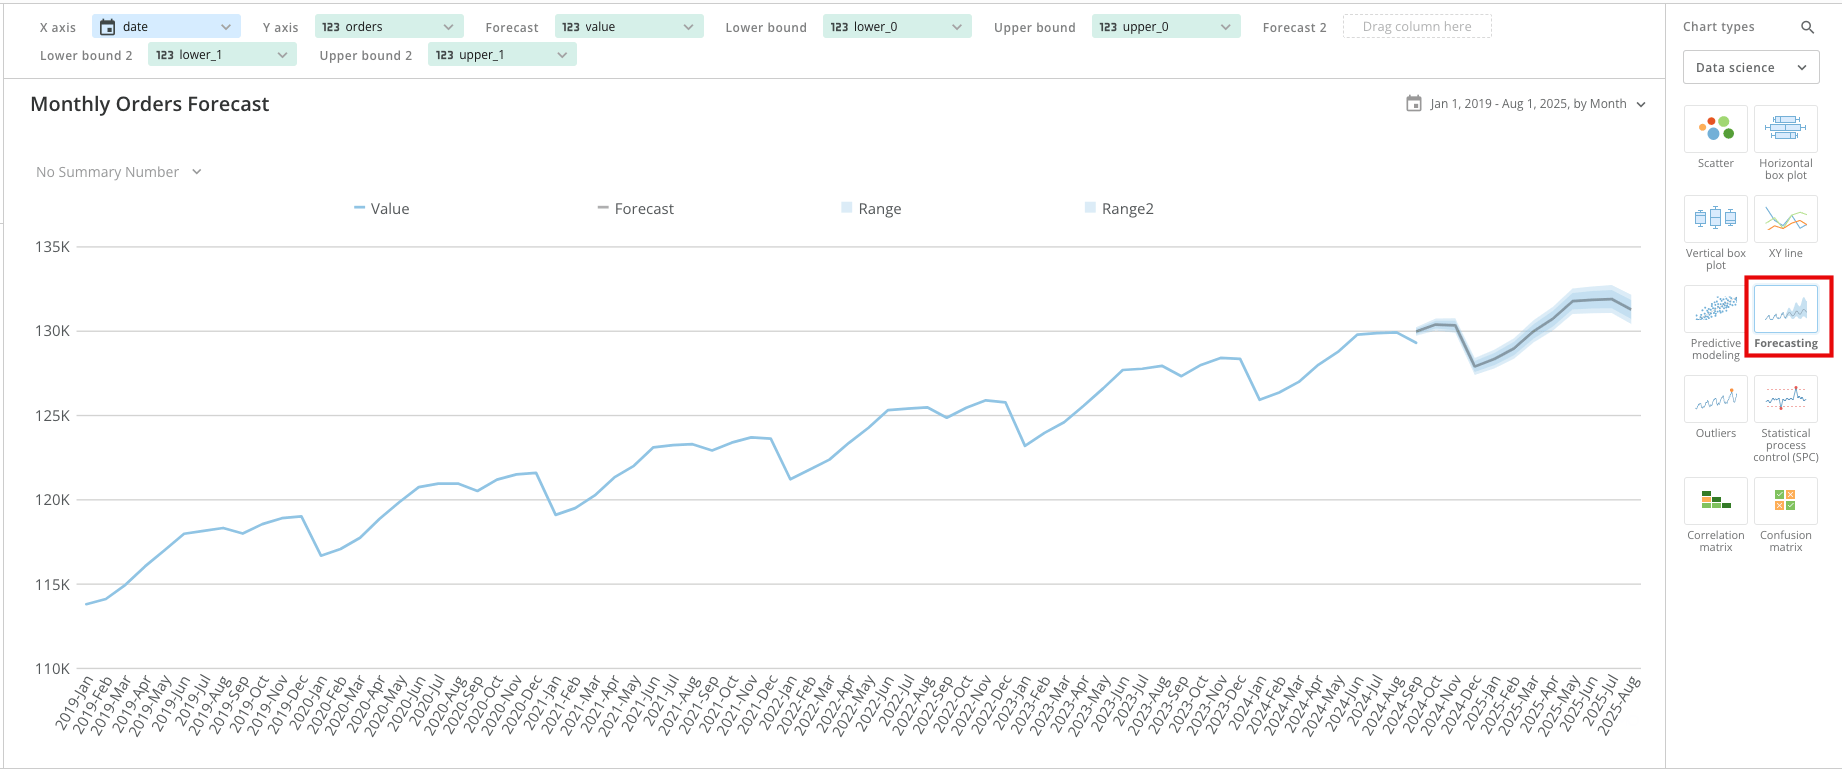
You can interpret and explore the results of your forecast by opening the output DataSet in Analyzer. Use the chart type finder to choose a Forecasting Chart.
Use the upper and lower bound columns from your output DataSet to set your bounds and display the forecast confidence ranges.
Learn more about the [Forecasting Chart](/s/article/360043429093).
### Interpret Results from the AI Forecasting Tile
You can interpret and explore the results of your forecast by opening the output DataSet in Analyzer. Use the chart type finder to choose a Forecasting Chart.
Use the upper and lower bound columns from your output DataSet to set your bounds and display the forecast confidence ranges.
Learn more about the [Forecasting Chart](/s/article/360043429093).
 ### Convert Input Granularity
Follow the steps below to convert your input DataSet from a minute granularity to a month/day or other specific granularity when creating a DataFlow with the AI Forecasting tile.
#### Add a Granularity Formula
Drag and drop an **Add Formula** tile onto the authoring canvas.
Connect that tile to your DataSet.
Select the **Add Formula** tile to expand the tile editor.
Select **Configuration** (tab).
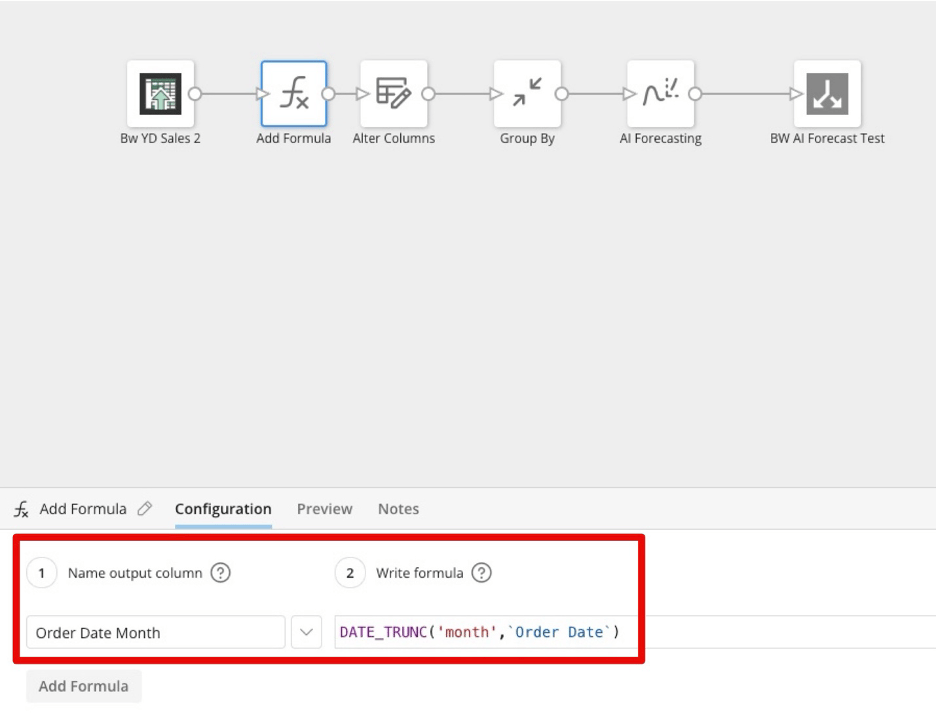
Enter a name in the **Name output column** field.\
For example, to create a column granularity by month, you can enter “Order Date Month.”
Enter the corresponding formula in the **Write formula** field.\
For example, to order granularity by month, you can write `DATE_TRUNC ('month', 'Order Date')`.
### Convert Input Granularity
Follow the steps below to convert your input DataSet from a minute granularity to a month/day or other specific granularity when creating a DataFlow with the AI Forecasting tile.
#### Add a Granularity Formula
Drag and drop an **Add Formula** tile onto the authoring canvas.
Connect that tile to your DataSet.
Select the **Add Formula** tile to expand the tile editor.
Select **Configuration** (tab).
Enter a name in the **Name output column** field.\
For example, to create a column granularity by month, you can enter “Order Date Month.”
Enter the corresponding formula in the **Write formula** field.\
For example, to order granularity by month, you can write `DATE_TRUNC ('month', 'Order Date')`.
 #### Alter Your Column Granularity
Drag and drop an **Alter Columns** tile onto the authoring canvas.
Connect that tile to your DataFlow.
Select the **Alter Columns** tile to expand the tile editor.
Select **Configuration** (tab).
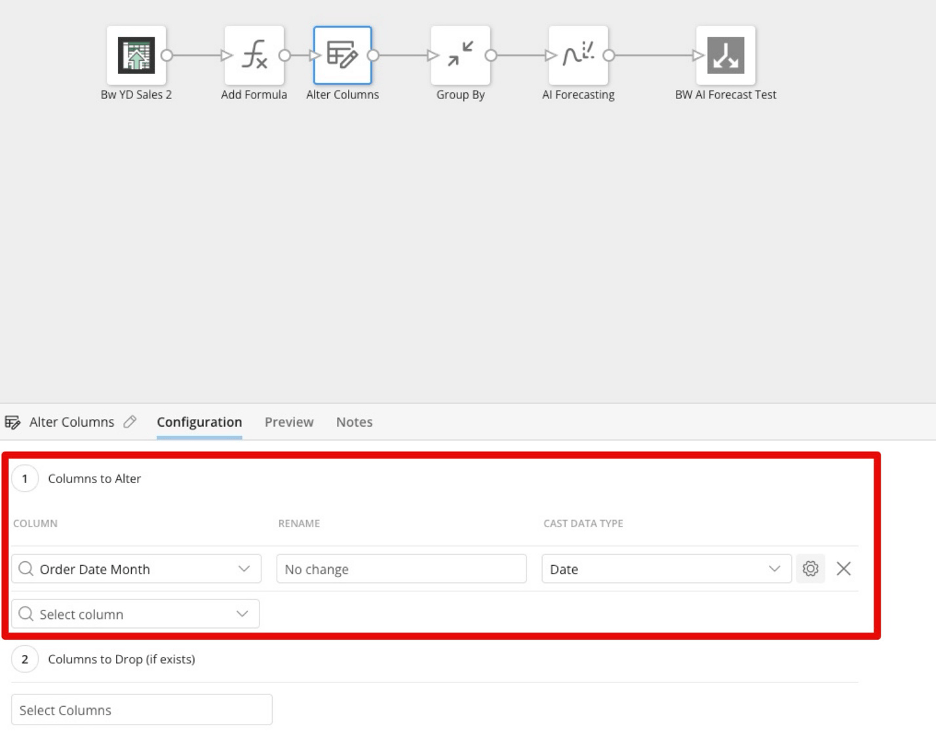
Alter applicable columns.\
For example, to order granularity by month, you can select the "Order Date Month" column you created with your granularity formula.\
Then, change the Cast Data Type to “Date.”
#### Alter Your Column Granularity
Drag and drop an **Alter Columns** tile onto the authoring canvas.
Connect that tile to your DataFlow.
Select the **Alter Columns** tile to expand the tile editor.
Select **Configuration** (tab).
Alter applicable columns.\
For example, to order granularity by month, you can select the "Order Date Month" column you created with your granularity formula.\
Then, change the Cast Data Type to “Date.”
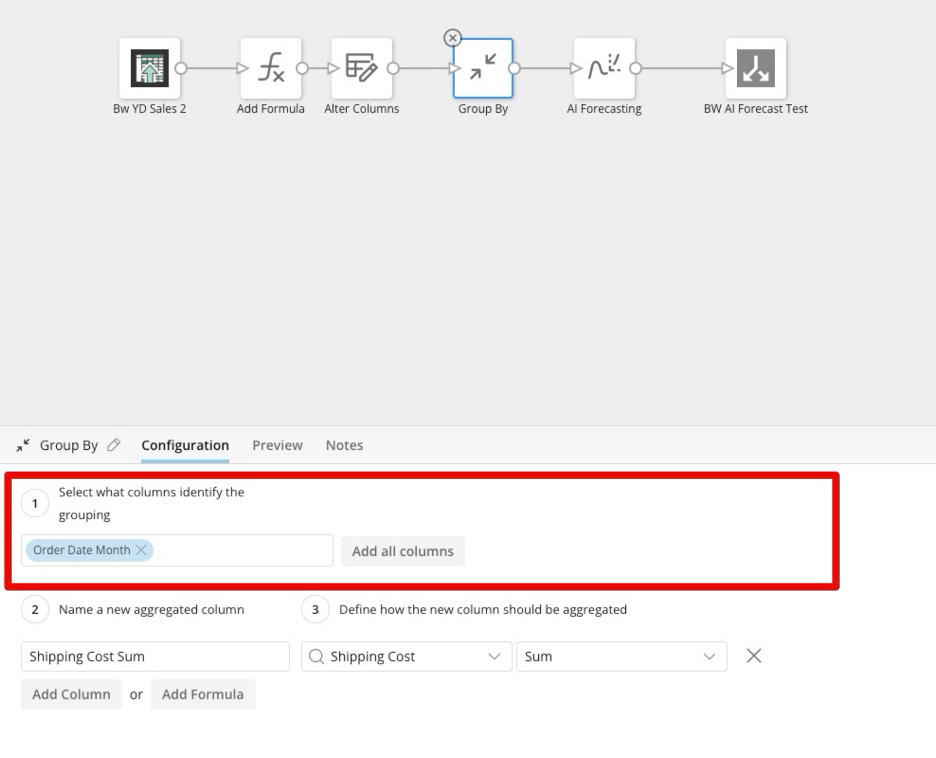
 #### Group Your Column by Granularity
Drag and drop a **Group By** tile onto the authoring canvas.
Connect that tile to your DataFlow.
Select the **Group By** tile to expand the tile editor.
Select **Configuration** (tab).
Select the applicable columns.\
For example, to order granularity by month, you can select the "Order Date Month"column you created and altered in the Add Formula and Alter Columns tiles.
You now have a column that you have altered and grouped according to your specified granularity.
#### Group Your Column by Granularity
Drag and drop a **Group By** tile onto the authoring canvas.
Connect that tile to your DataFlow.
Select the **Group By** tile to expand the tile editor.
Select **Configuration** (tab).
Select the applicable columns.\
For example, to order granularity by month, you can select the "Order Date Month"column you created and altered in the Add Formula and Alter Columns tiles.
You now have a column that you have altered and grouped according to your specified granularity.
 #### Configure Your AI Forecasting Tile to Match Its Input Granularity
Drag and drop an **AI Forecasting** tile onto the authoring canvas and connect to your DataFlow.
Select the **AI Forecasting** tile to expand the tile editor.
Select **Configuration** (tab).
Adjust your date and value columns, then choose a forecast frequency and length, and select a seasonality period—all according to your specified granularity.\
For example, if you are ordering granularity by month, you can select your configured column “Order Date Month,” a value sum, a “Monthly” frequency, and a seasonality period of "12."
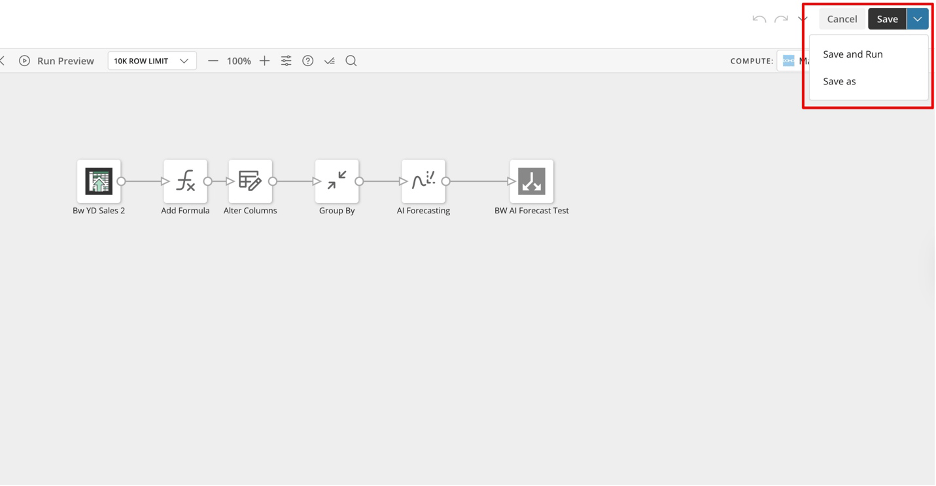
#### Save Your Granularity Configuration
Select **Save** to save your configuration.
You can also check your work by selecting the dropdown next to Save and selecting **Save and Run**.
#### Configure Your AI Forecasting Tile to Match Its Input Granularity
Drag and drop an **AI Forecasting** tile onto the authoring canvas and connect to your DataFlow.
Select the **AI Forecasting** tile to expand the tile editor.
Select **Configuration** (tab).
Adjust your date and value columns, then choose a forecast frequency and length, and select a seasonality period—all according to your specified granularity.\
For example, if you are ordering granularity by month, you can select your configured column “Order Date Month,” a value sum, a “Monthly” frequency, and a seasonality period of "12."
#### Save Your Granularity Configuration
Select **Save** to save your configuration.
You can also check your work by selecting the dropdown next to Save and selecting **Save and Run**.
 The Save and Run DataFlow modal displays.
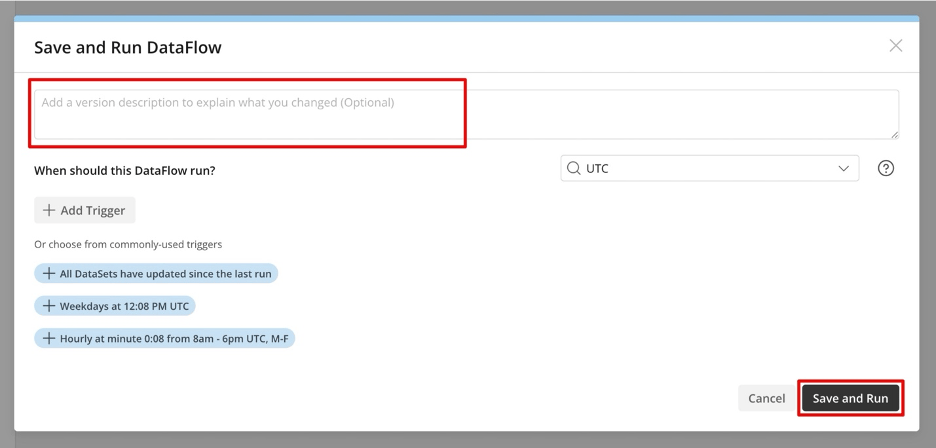 (Optional) Add a version description to explain what you changed.
Select **Save and Run** to run the DataFlow and ensure that all granularity columns in the ETL flow match.
**Important:** To ensure your DataFlow runs properly, you must match the data
granularity feeding the AI Forecasting tile with the [granularity selected in
the AI Forecasting tile
configuration](#configure-your-ai-forecasting-tile-to-match-its-input-granularity).
## AI Model Inference Tile
(Optional) Add a version description to explain what you changed.
Select **Save and Run** to run the DataFlow and ensure that all granularity columns in the ETL flow match.
**Important:** To ensure your DataFlow runs properly, you must match the data
granularity feeding the AI Forecasting tile with the [granularity selected in
the AI Forecasting tile
configuration](#configure-your-ai-forecasting-tile-to-match-its-input-granularity).
## AI Model Inference Tile
 The AI Model Inference tile allows you to gather insights from your input DataSet and use the inferred output DataSet throughout Domo.
You can also use the output DataSet from your AI Model Inference tile to create App Studio apps and DataBricks that display data analysis, model performance, model predictions, and what-if analysis examples to share with other people in your organization.
### Required Grant
To access the AI Model Inference tile in Magic ETL, the following grant must be enabled for your role:
* \*\*Use AI Services —\*\*Allows a user to access and use the [AI Services](/s/article/000005279) in Domo.
For more information on grants, see [Managing Custom Roles](/s/article/360043438973).
### Configure the AI Model Inference Tile
**Important:** The Magic ETL Preview function doesn't work with the AI Model
Inference tile.
1. Select the DataSet you want to gather inferences from and open it in Magic ETL.
2. In the Magic ETL sidebar, expand **Data Science** and drag an **AI Model Inference** tile to the canvas.
The AI Model Inference tile allows you to gather insights from your input DataSet and use the inferred output DataSet throughout Domo.
You can also use the output DataSet from your AI Model Inference tile to create App Studio apps and DataBricks that display data analysis, model performance, model predictions, and what-if analysis examples to share with other people in your organization.
### Required Grant
To access the AI Model Inference tile in Magic ETL, the following grant must be enabled for your role:
* \*\*Use AI Services —\*\*Allows a user to access and use the [AI Services](/s/article/000005279) in Domo.
For more information on grants, see [Managing Custom Roles](/s/article/360043438973).
### Configure the AI Model Inference Tile
**Important:** The Magic ETL Preview function doesn't work with the AI Model
Inference tile.
1. Select the DataSet you want to gather inferences from and open it in Magic ETL.
2. In the Magic ETL sidebar, expand **Data Science** and drag an **AI Model Inference** tile to the canvas.
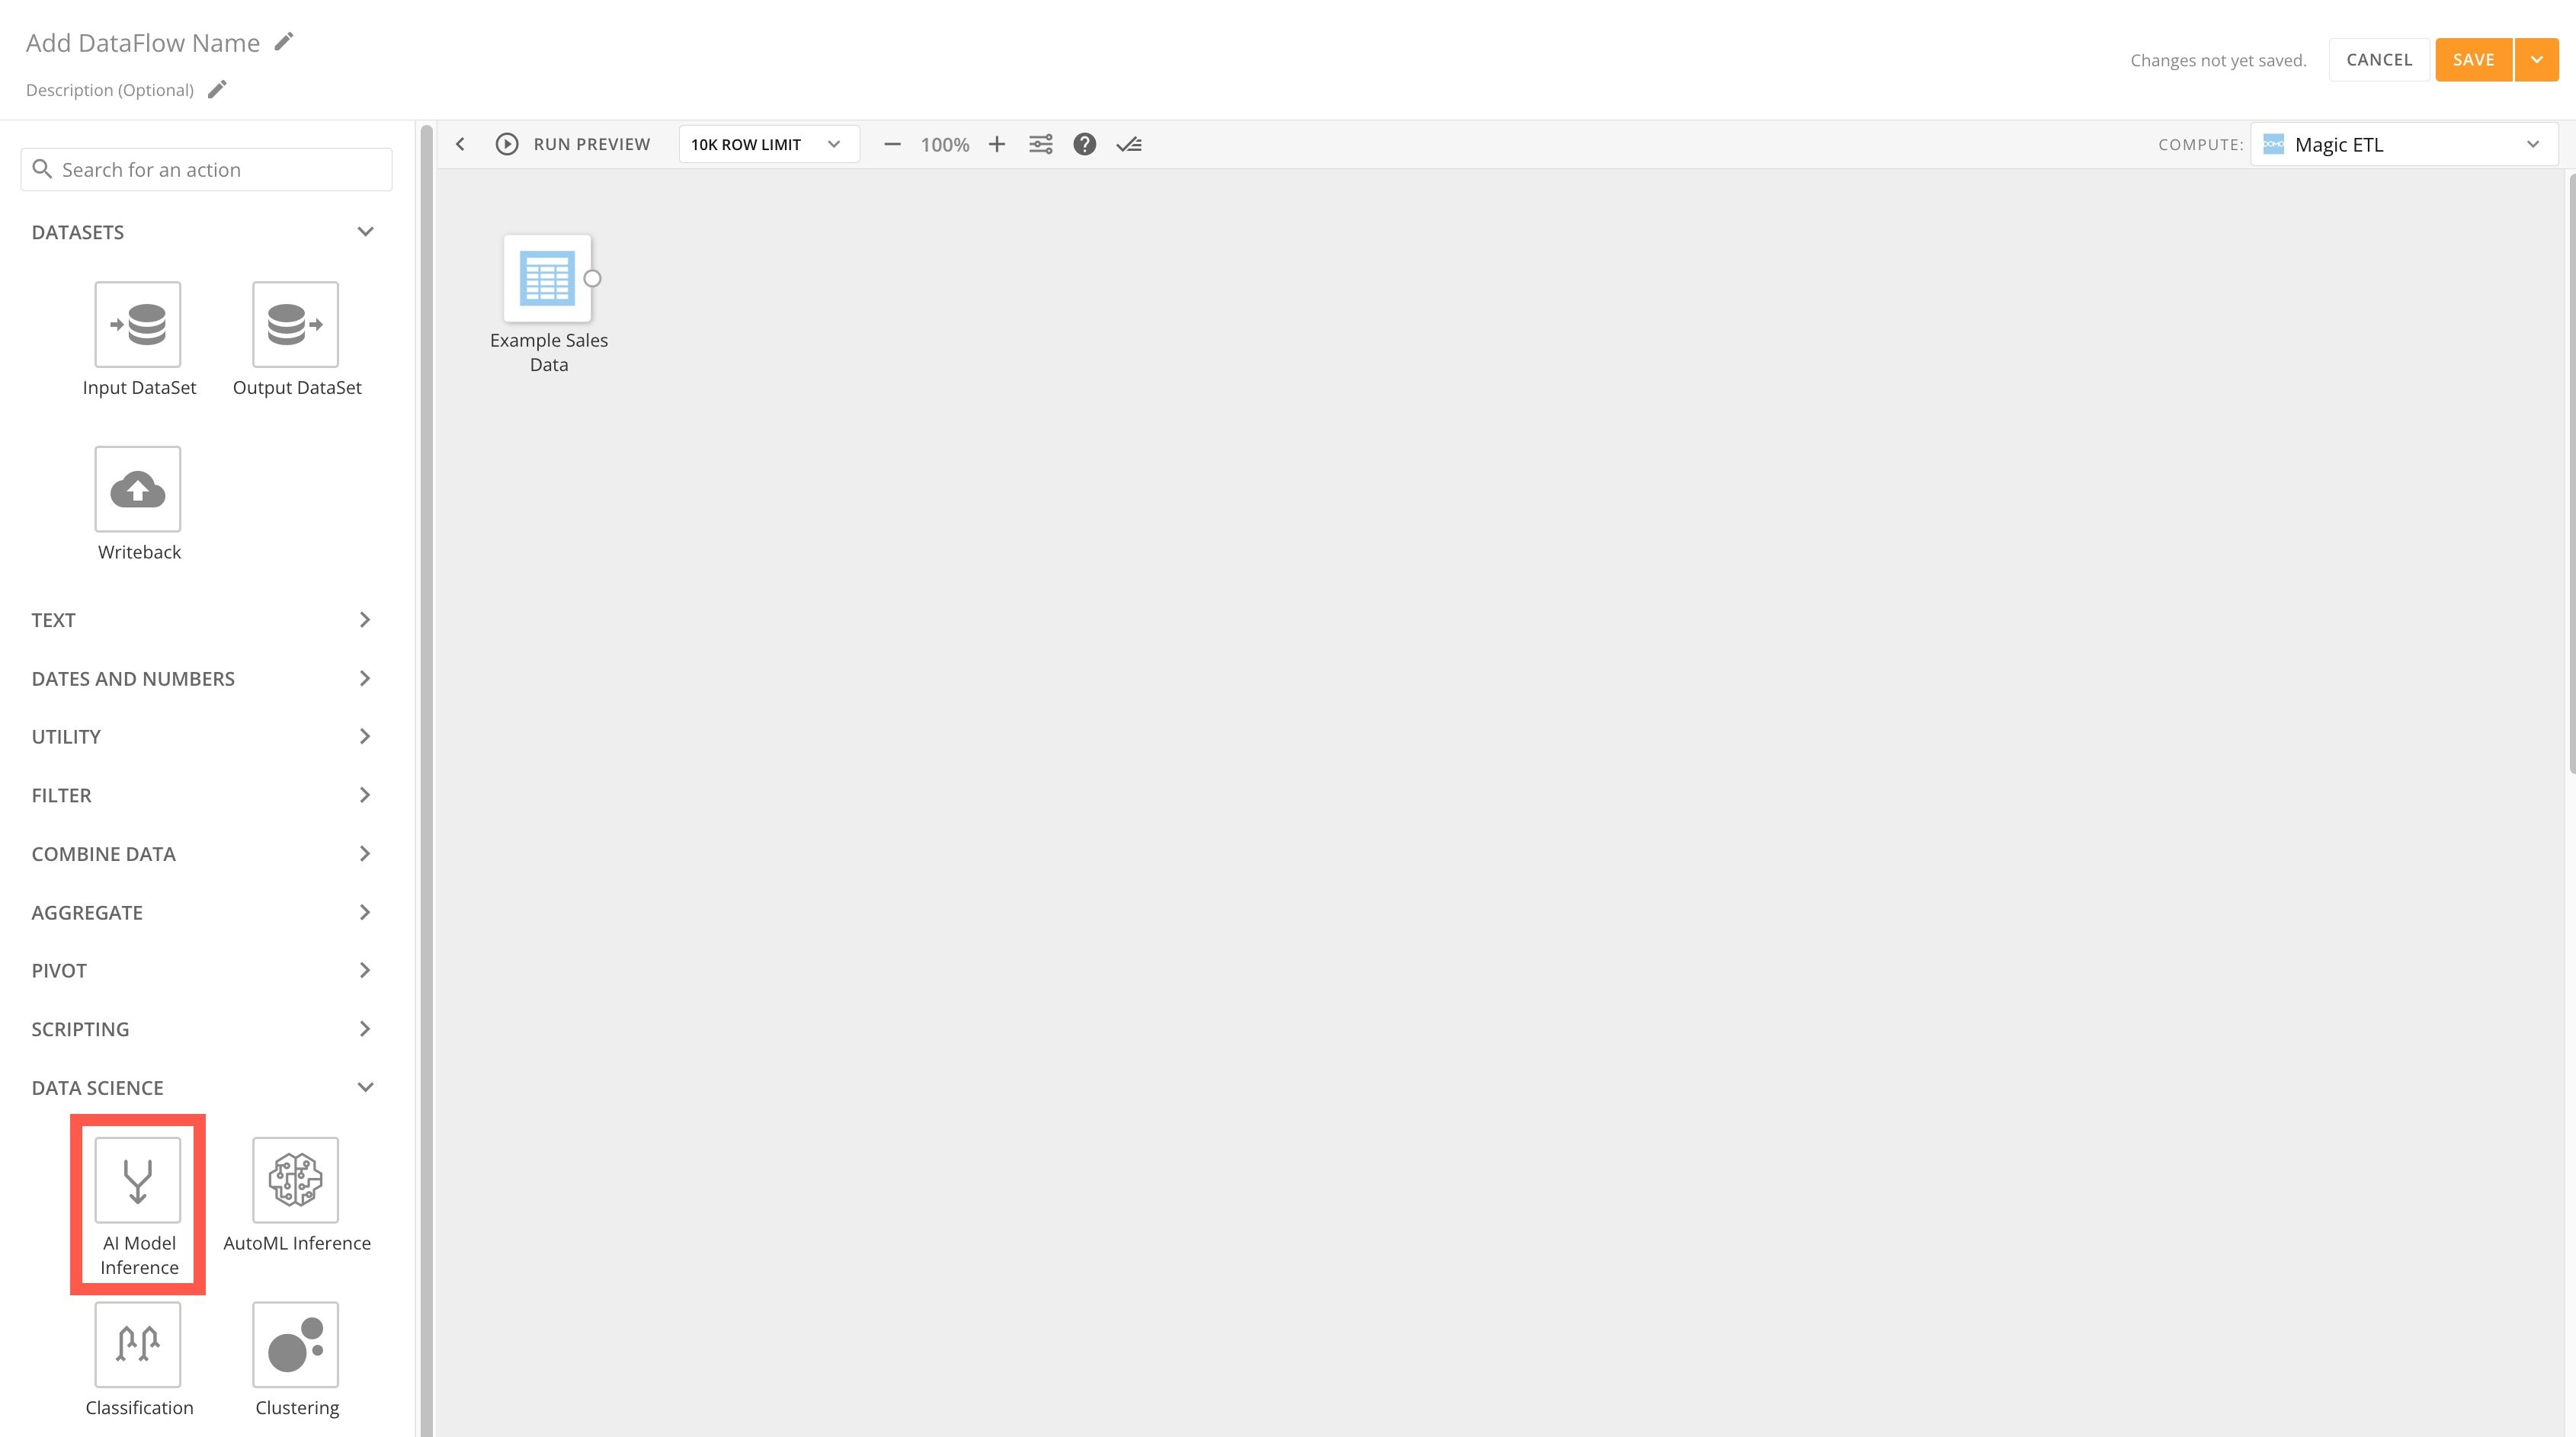 3. Connect your input DataSet to the tile. You can only use one DataSet as input.
4. In the tile editor, choose **Select a Model** to search for and choose a model to use for your inference. The model schema must match the schema of the input DataSet. If the schemas do not match, an error message displays.
3. Connect your input DataSet to the tile. You can only use one DataSet as input.
4. In the tile editor, choose **Select a Model** to search for and choose a model to use for your inference. The model schema must match the schema of the input DataSet. If the schemas do not match, an error message displays.
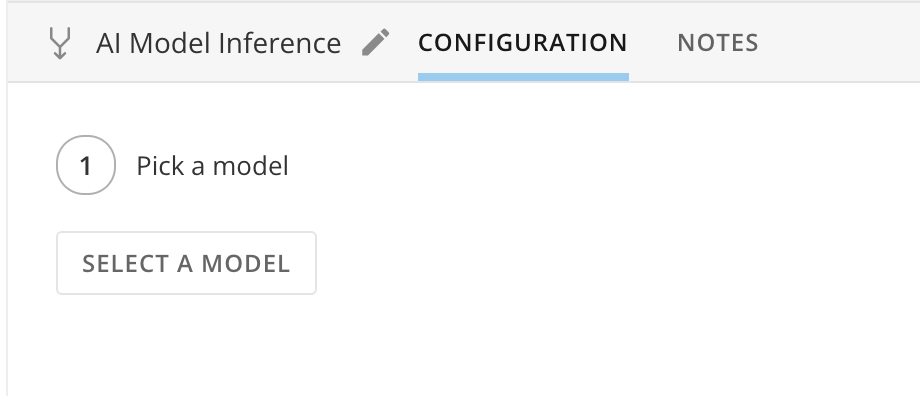 If the schema of your input DataSet matches the model's schema, you can select the model you want to bring in. You can only use models with a CSV type in Magic ETL.
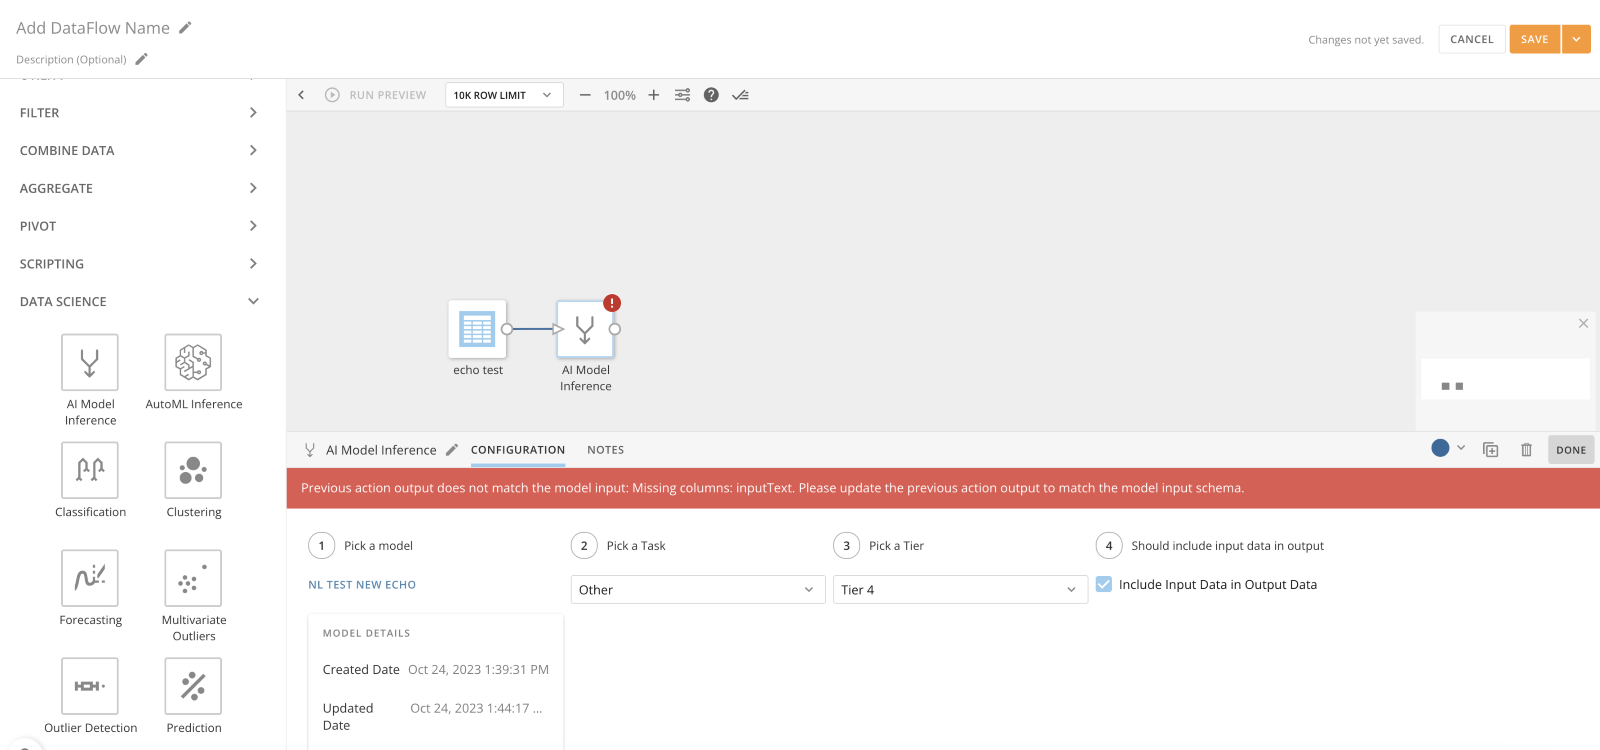 5. Depending on the model, you can select a task if multiple options are available in the **Pick a Task** dropdown. The model task automatically generates from your selected model. Models may have multiple tasks, but only one task is selected for the DataFlow. In the example used above, only the "Other" task type is available.
6. Select a tier, depending on the number of resources used to run the model. A *tier*is the size of the resources the model is running with and the number of central processing units (CPUs) used. Learn more about [compute tiers](/s/article/36004740075).
7. (Optional) Check the box labeled **Include Input Data in Output Data** to duplicate all the rows from your input DataSet. This means that if you have 10 rows of data in your input, there will be 10 rows of data in your output.\
If you leave the box unchecked, only the inferred data is included in the output DataSet.
## Text Generation Tile
5. Depending on the model, you can select a task if multiple options are available in the **Pick a Task** dropdown. The model task automatically generates from your selected model. Models may have multiple tasks, but only one task is selected for the DataFlow. In the example used above, only the "Other" task type is available.
6. Select a tier, depending on the number of resources used to run the model. A *tier*is the size of the resources the model is running with and the number of central processing units (CPUs) used. Learn more about [compute tiers](/s/article/36004740075).
7. (Optional) Check the box labeled **Include Input Data in Output Data** to duplicate all the rows from your input DataSet. This means that if you have 10 rows of data in your input, there will be 10 rows of data in your output.\
If you leave the box unchecked, only the inferred data is included in the output DataSet.
## Text Generation Tile
 Valuable information is often inaccessible inside text columns in your DataSets—and parsing, categorizing, and analyzing text can be manual and time-consuming. The Text Generation tile leverages Domo AI to translate and process text fields, allowing you to analyze and take advantage of your text data's full value.
### Required Grants
To access the Text Generation tile in Magic ETL, the following grants must be enabled for your role:
* Execute AutoML
* Create AI Service Models
* Use AI Services
Learn more about [grants](/s/article/360043438973).
**Important:** You must also have AI Services enabled and the ability to
create a DataFlow. Learn how to [create a DataFlow](/s/article/360055259234).
### Configure the Text Generation Tile
1. Open the Magic ETL canvas and choose an input DataSet that contains a text column you want to analyze.
**Important:** Due to an AWS limitation, if the DataSet you choose has fewer than 100 rows, the
system automatically switches to non-batch mode.
Valuable information is often inaccessible inside text columns in your DataSets—and parsing, categorizing, and analyzing text can be manual and time-consuming. The Text Generation tile leverages Domo AI to translate and process text fields, allowing you to analyze and take advantage of your text data's full value.
### Required Grants
To access the Text Generation tile in Magic ETL, the following grants must be enabled for your role:
* Execute AutoML
* Create AI Service Models
* Use AI Services
Learn more about [grants](/s/article/360043438973).
**Important:** You must also have AI Services enabled and the ability to
create a DataFlow. Learn how to [create a DataFlow](/s/article/360055259234).
### Configure the Text Generation Tile
1. Open the Magic ETL canvas and choose an input DataSet that contains a text column you want to analyze.
**Important:** Due to an AWS limitation, if the DataSet you choose has fewer than 100 rows, the
system automatically switches to non-batch mode.
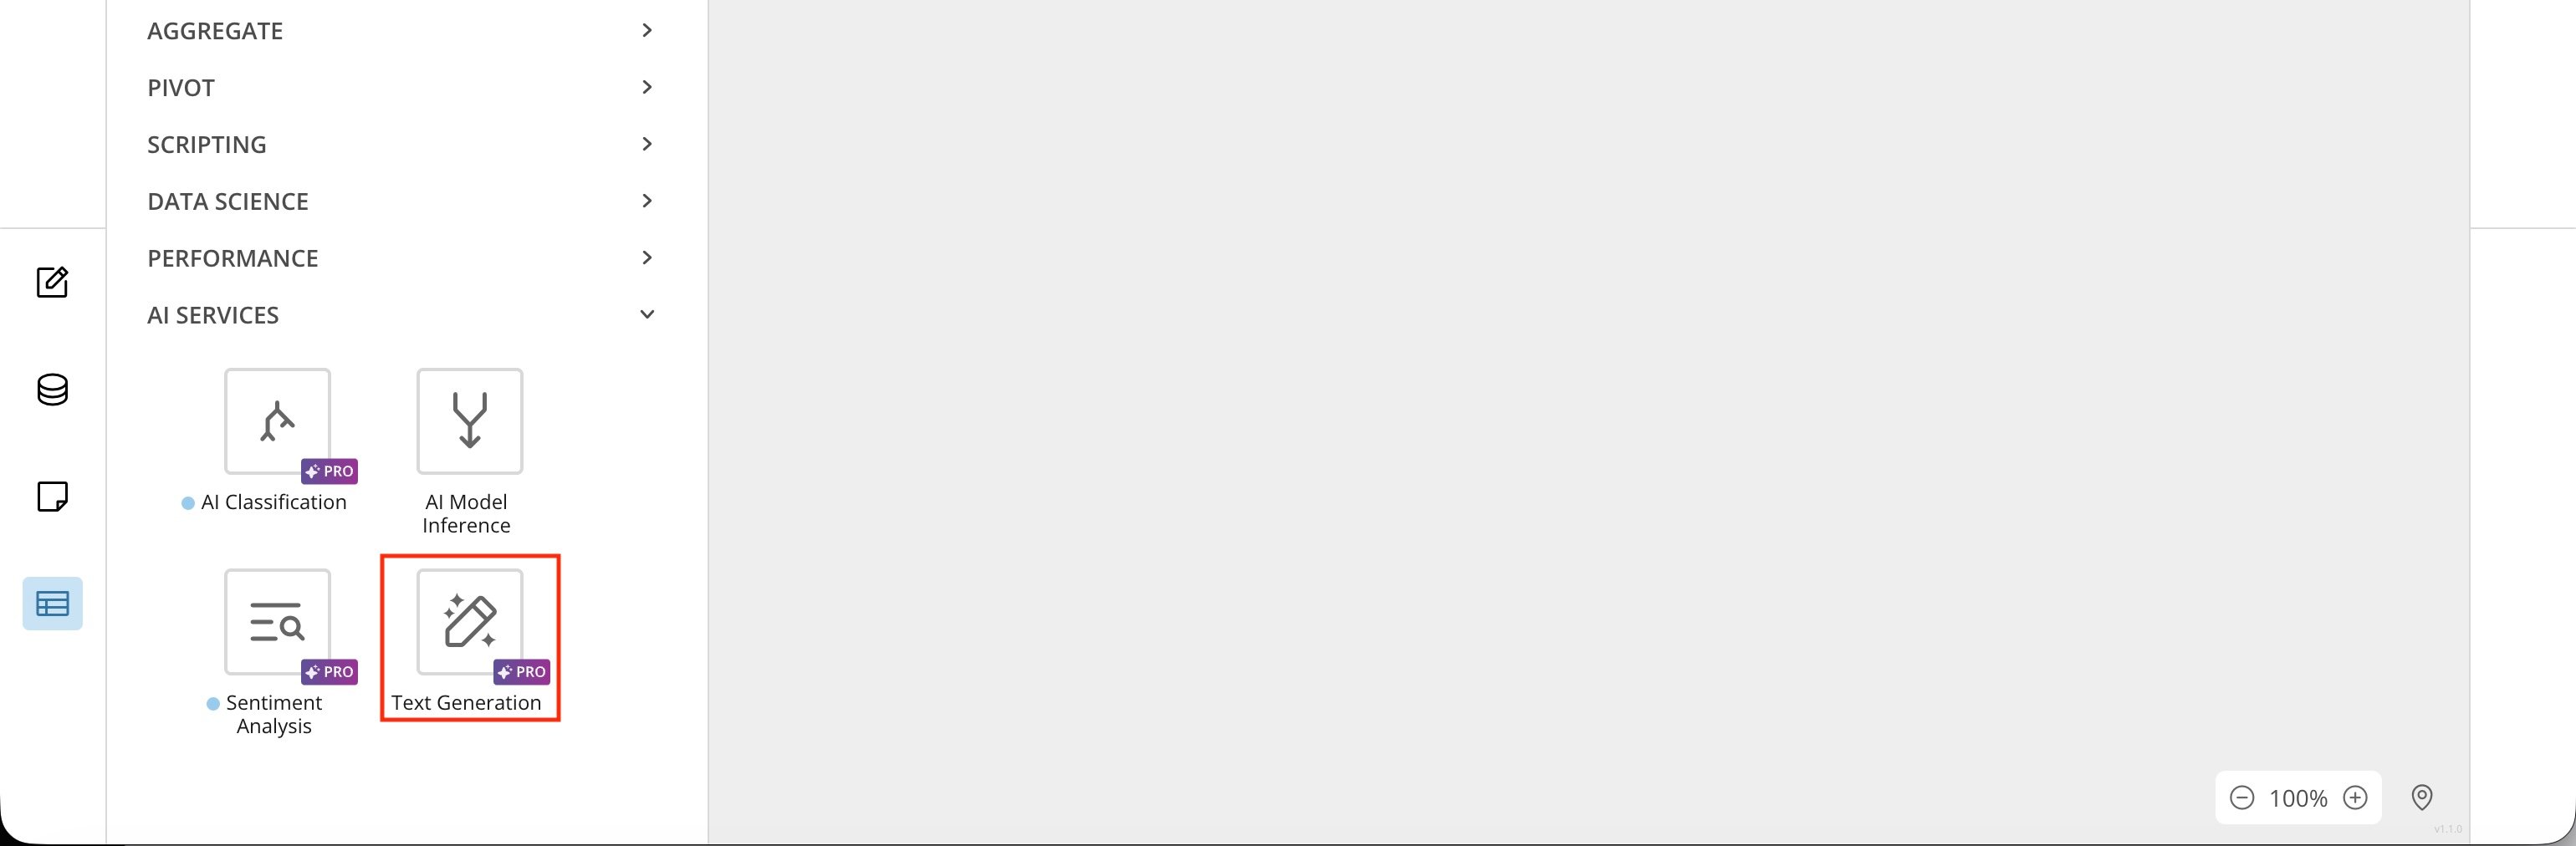
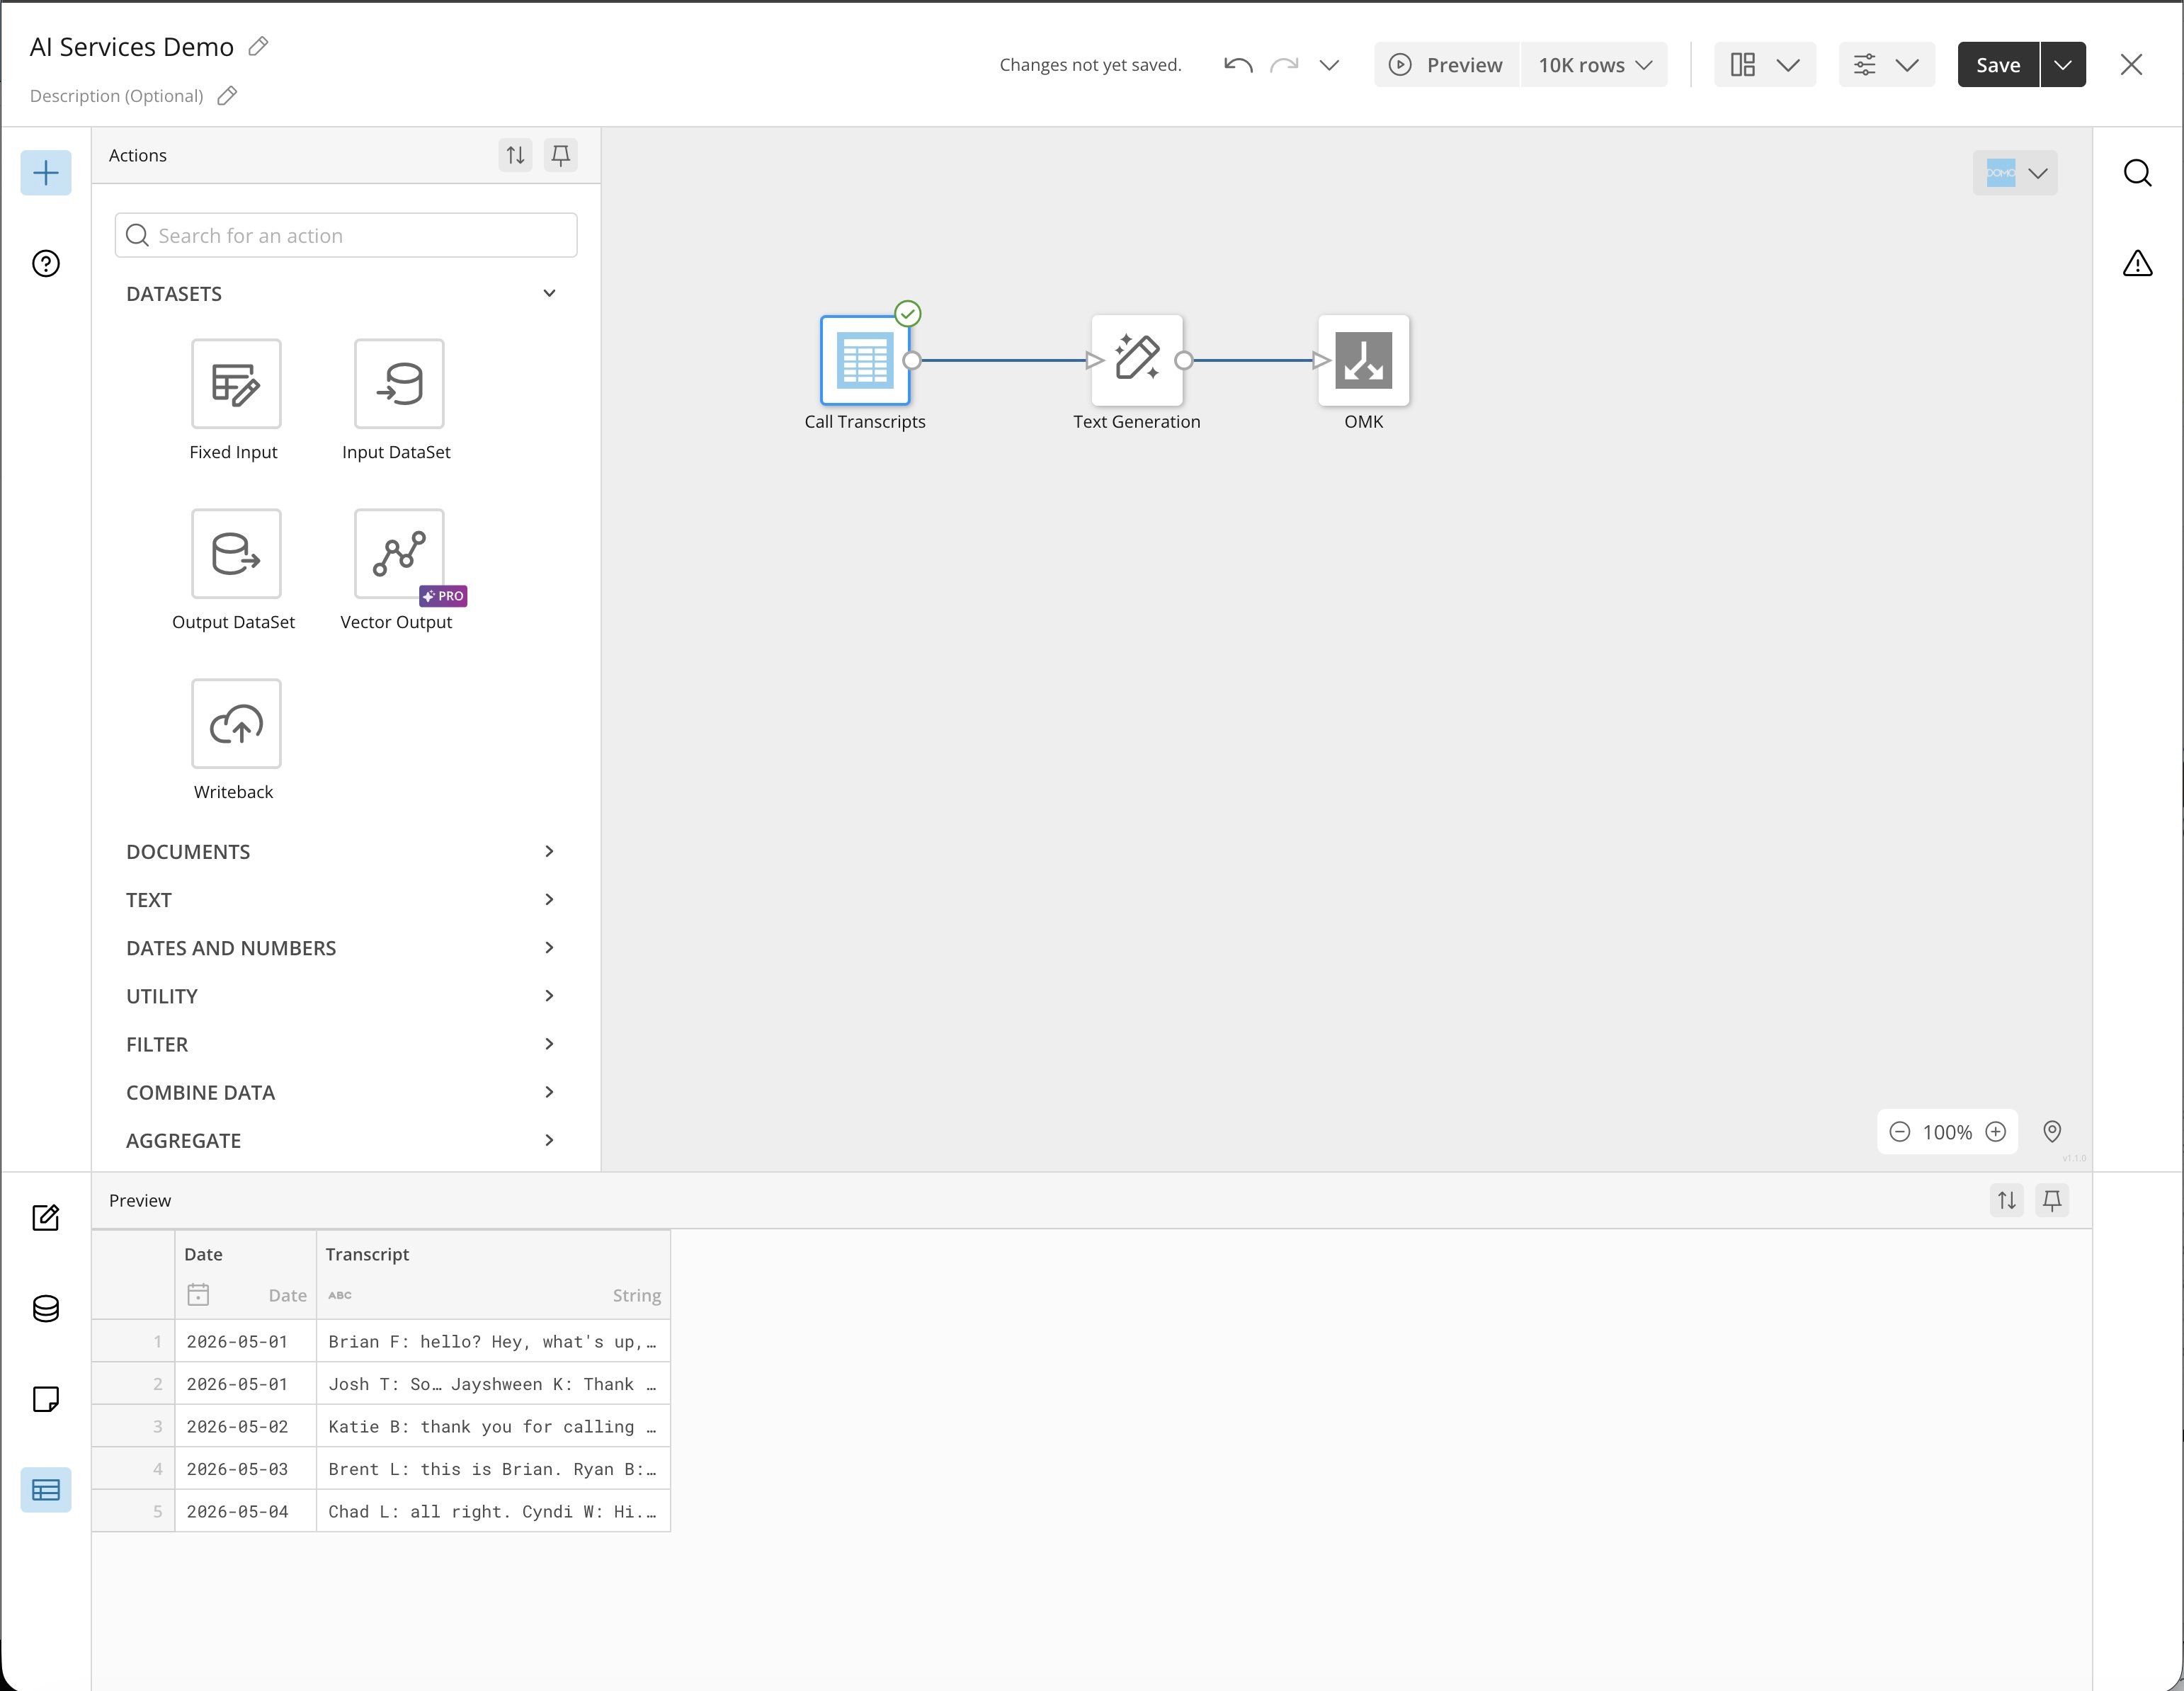 2\. Under **AI Services** in the left drawer, drag a Text Generation tile to the
canvas. The tile editor expands below the canvas.
2\. Under **AI Services** in the left drawer, drag a Text Generation tile to the
canvas. The tile editor expands below the canvas.
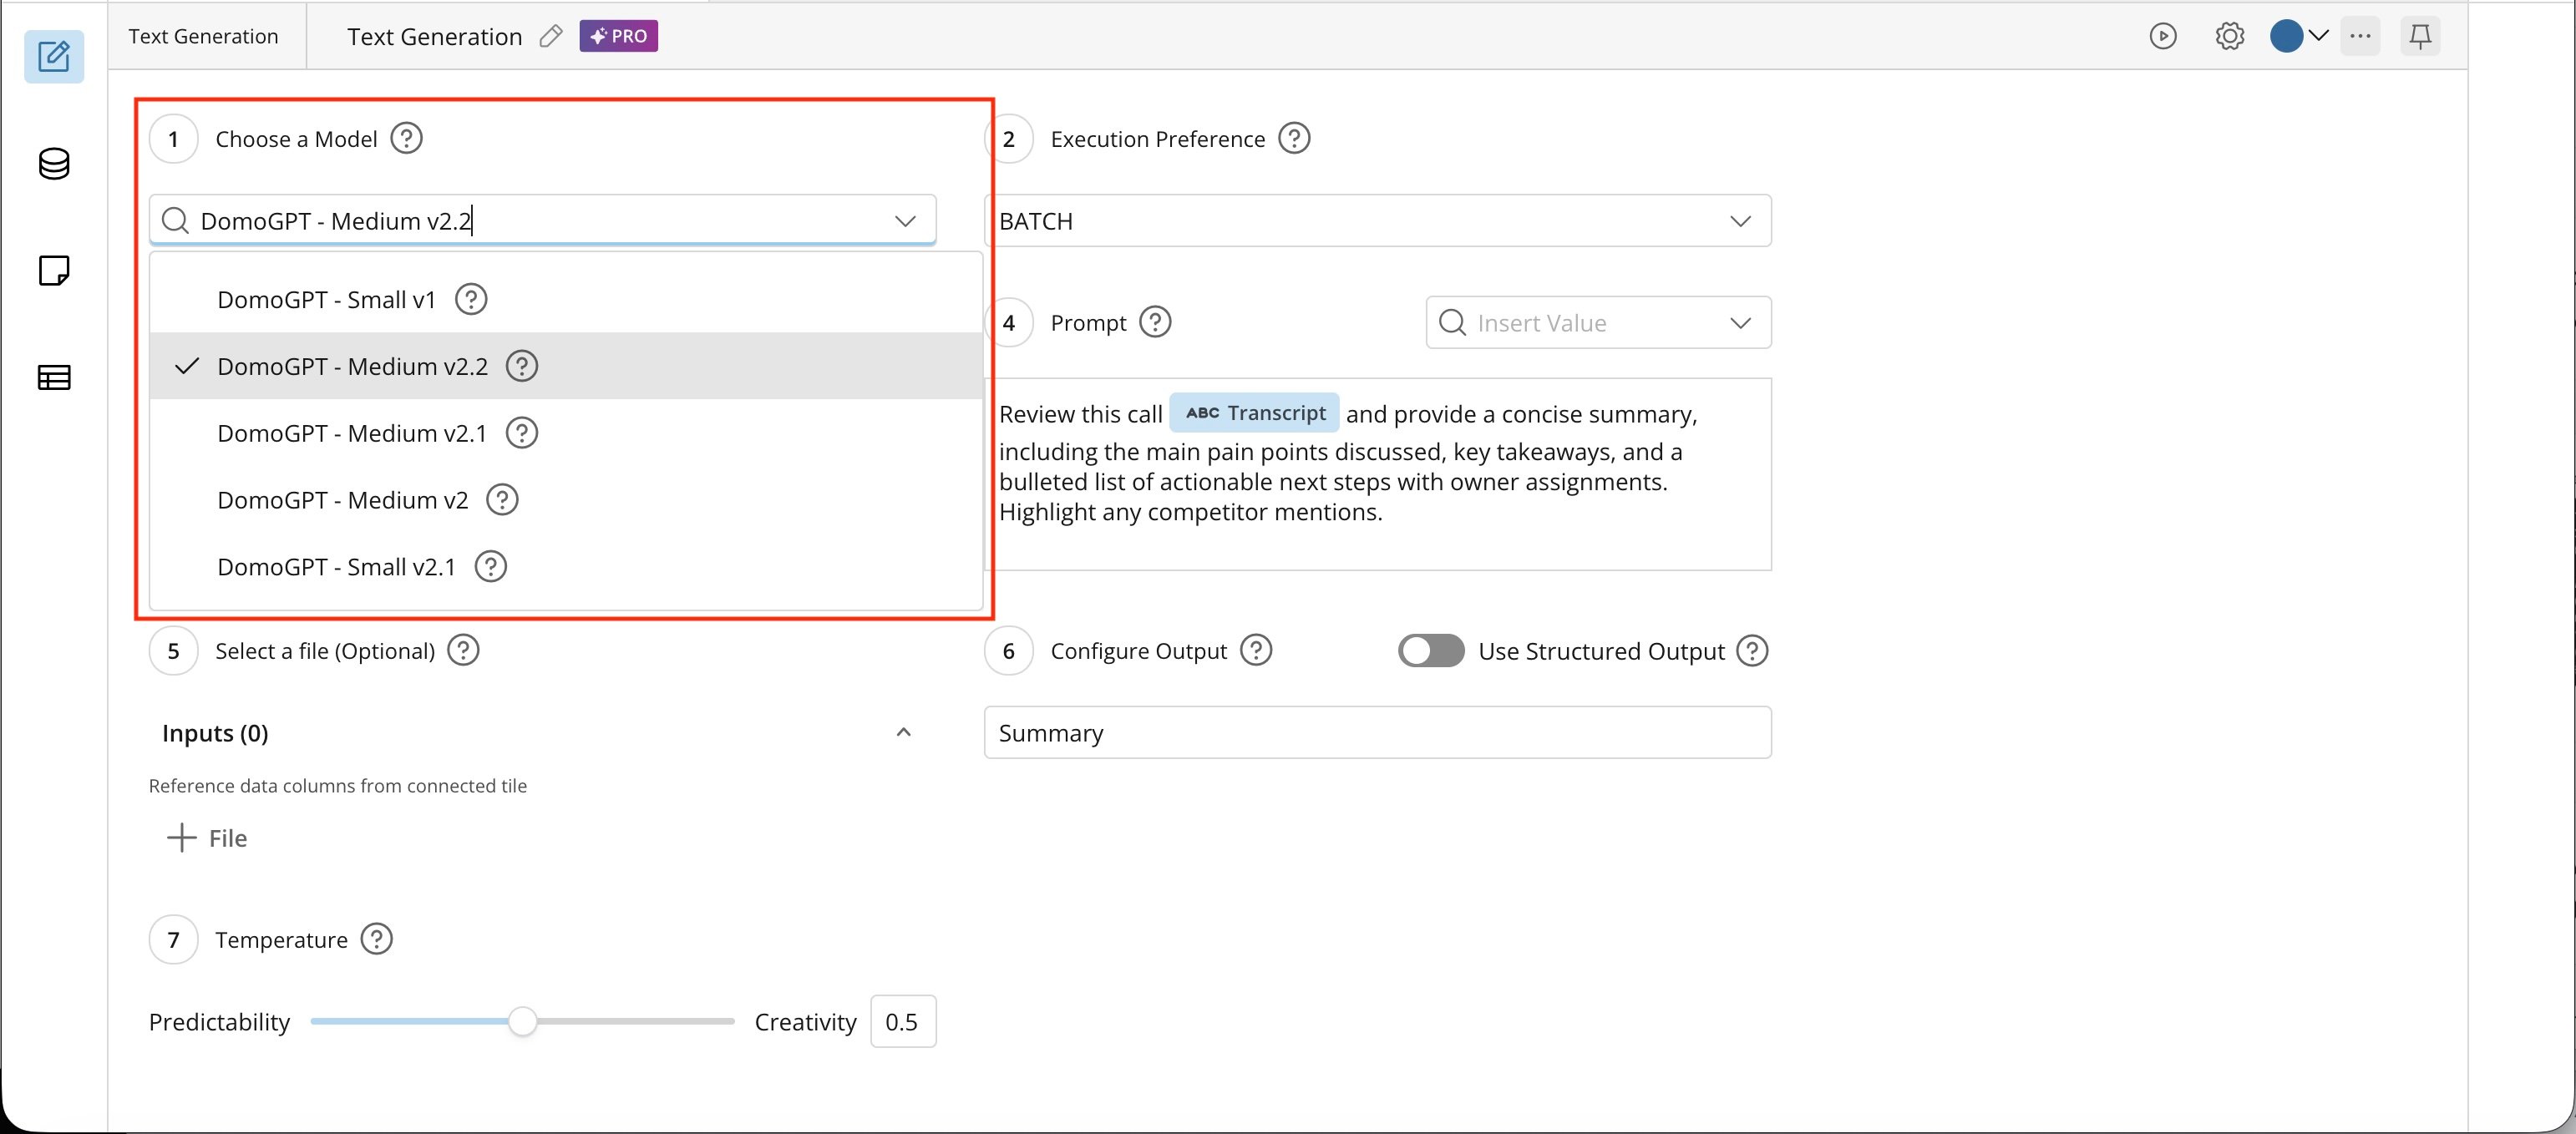
 3\. In the tile editor, choose the AI model you want to use with the Text
Generation tile.
3\. In the tile editor, choose the AI model you want to use with the Text
Generation tile.
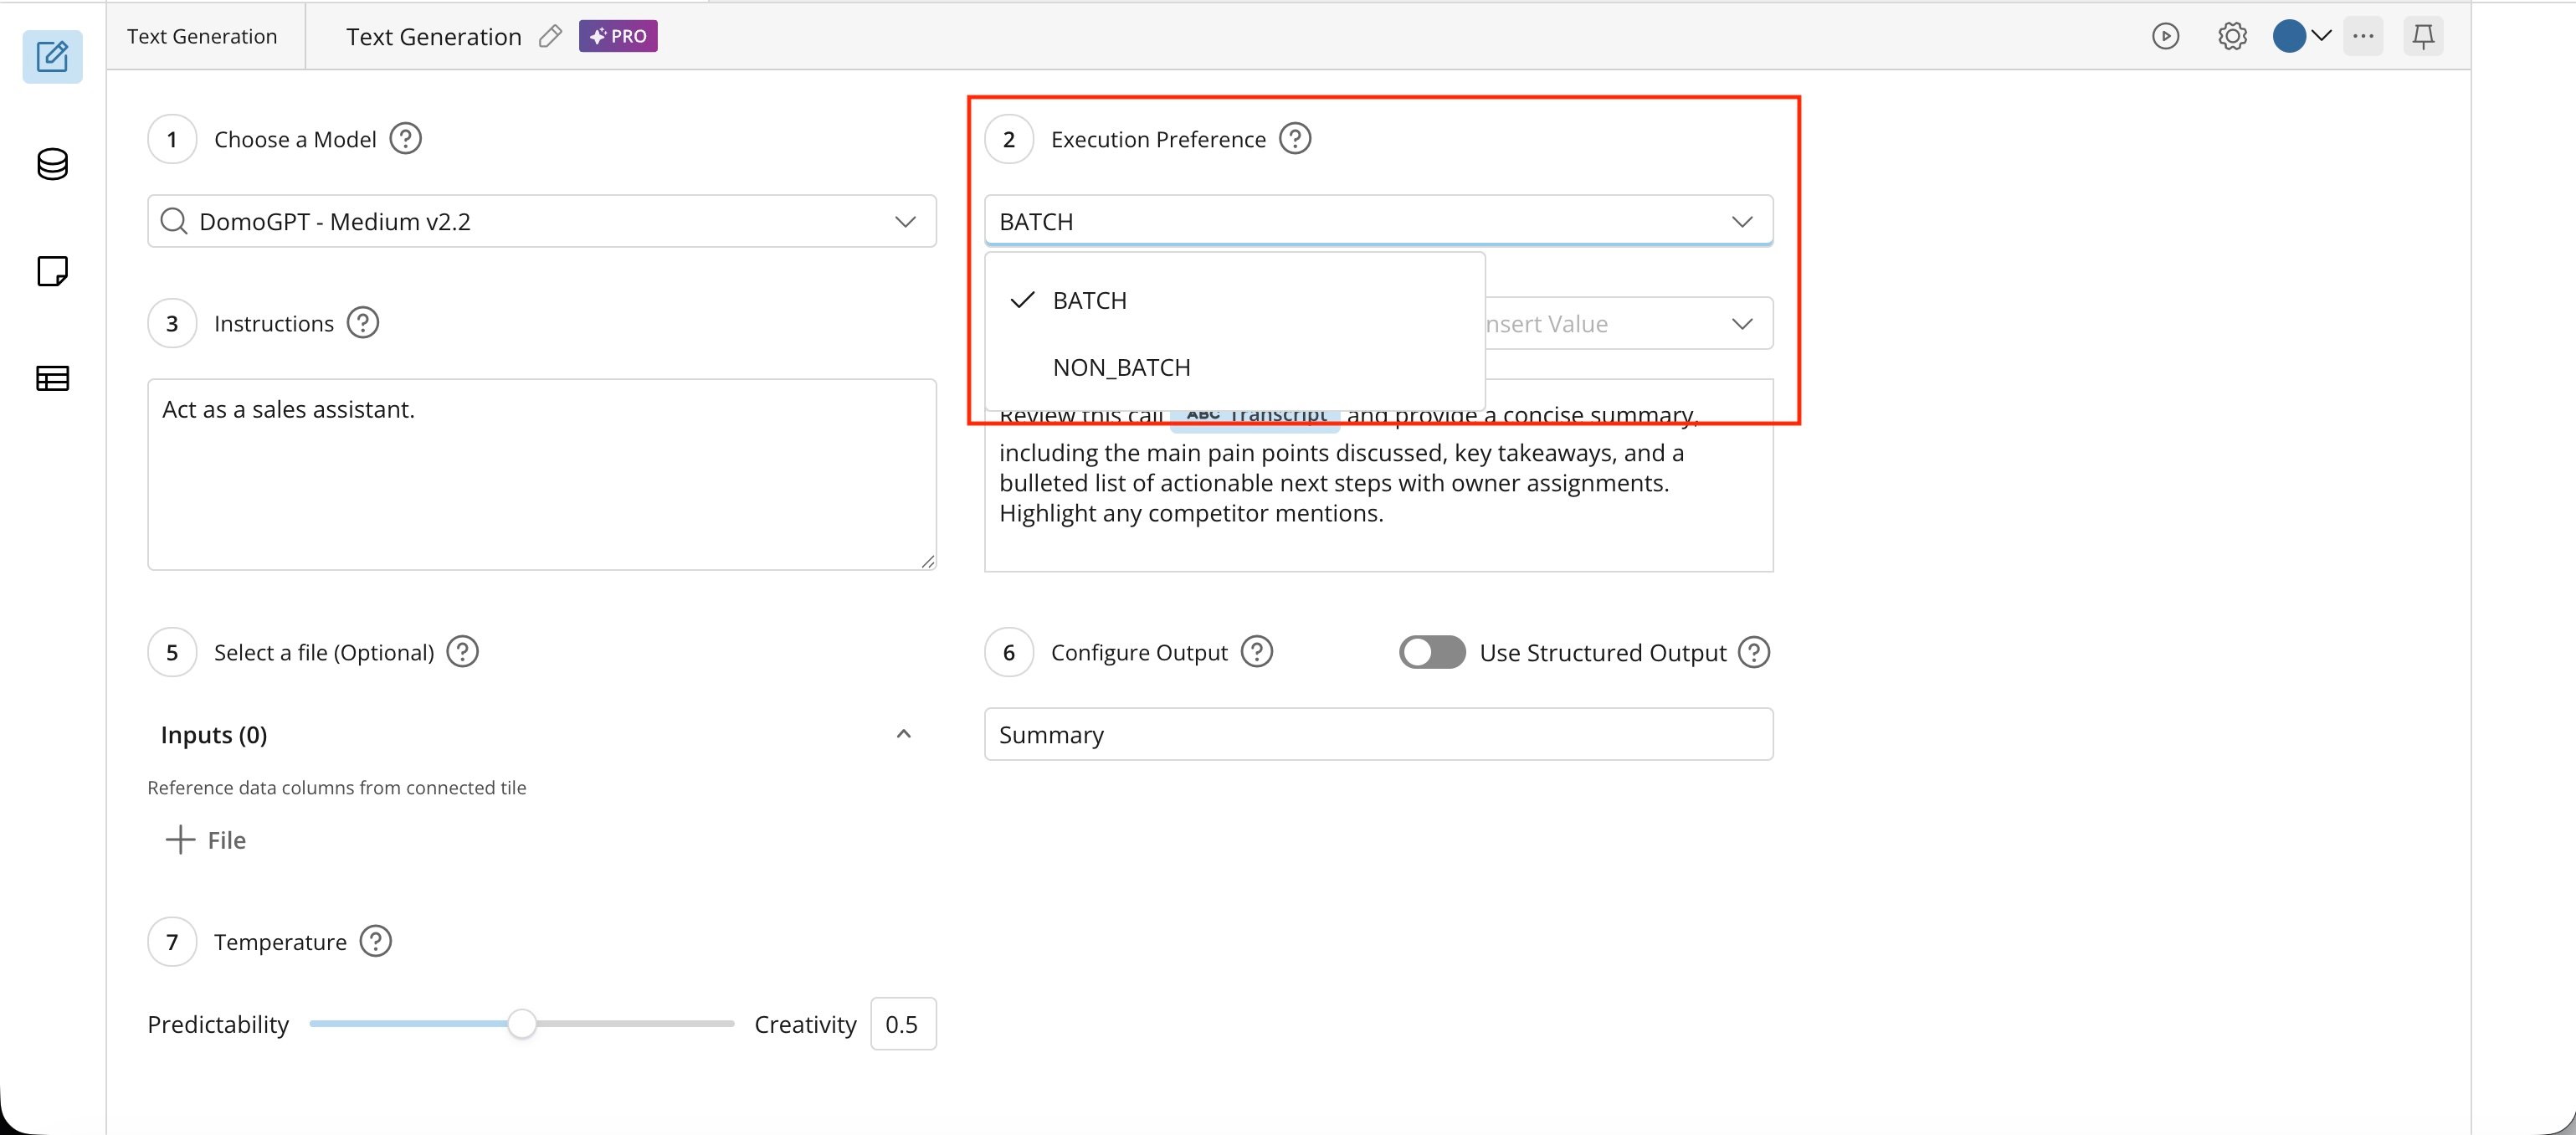
 4\. Choose the Execution Preference.
 **Note:** Batch and non-batch processing differ primarily in latency, cost, and use case.
Batch processing is designed for high-volume, asynchronous workloads, so execution times vary. It's generally more cost-effective.
Non-batch processing is intended for more consistent execution times with a small number of rows. Non-batch is always used when processing fewer than 100 rows of data.
5. Provide the model with instructions on how to analyze the column. Be very
specific; describe exactly what you want the model to do (and not to do).
**Tip:** Constructing a prompt that returns the results you need is a skill
that takes time and practice.
**Note:** Batch and non-batch processing differ primarily in latency, cost, and use case.
Batch processing is designed for high-volume, asynchronous workloads, so execution times vary. It's generally more cost-effective.
Non-batch processing is intended for more consistent execution times with a small number of rows. Non-batch is always used when processing fewer than 100 rows of data.
5. Provide the model with instructions on how to analyze the column. Be very
specific; describe exactly what you want the model to do (and not to do).
**Tip:** Constructing a prompt that returns the results you need is a skill
that takes time and practice.
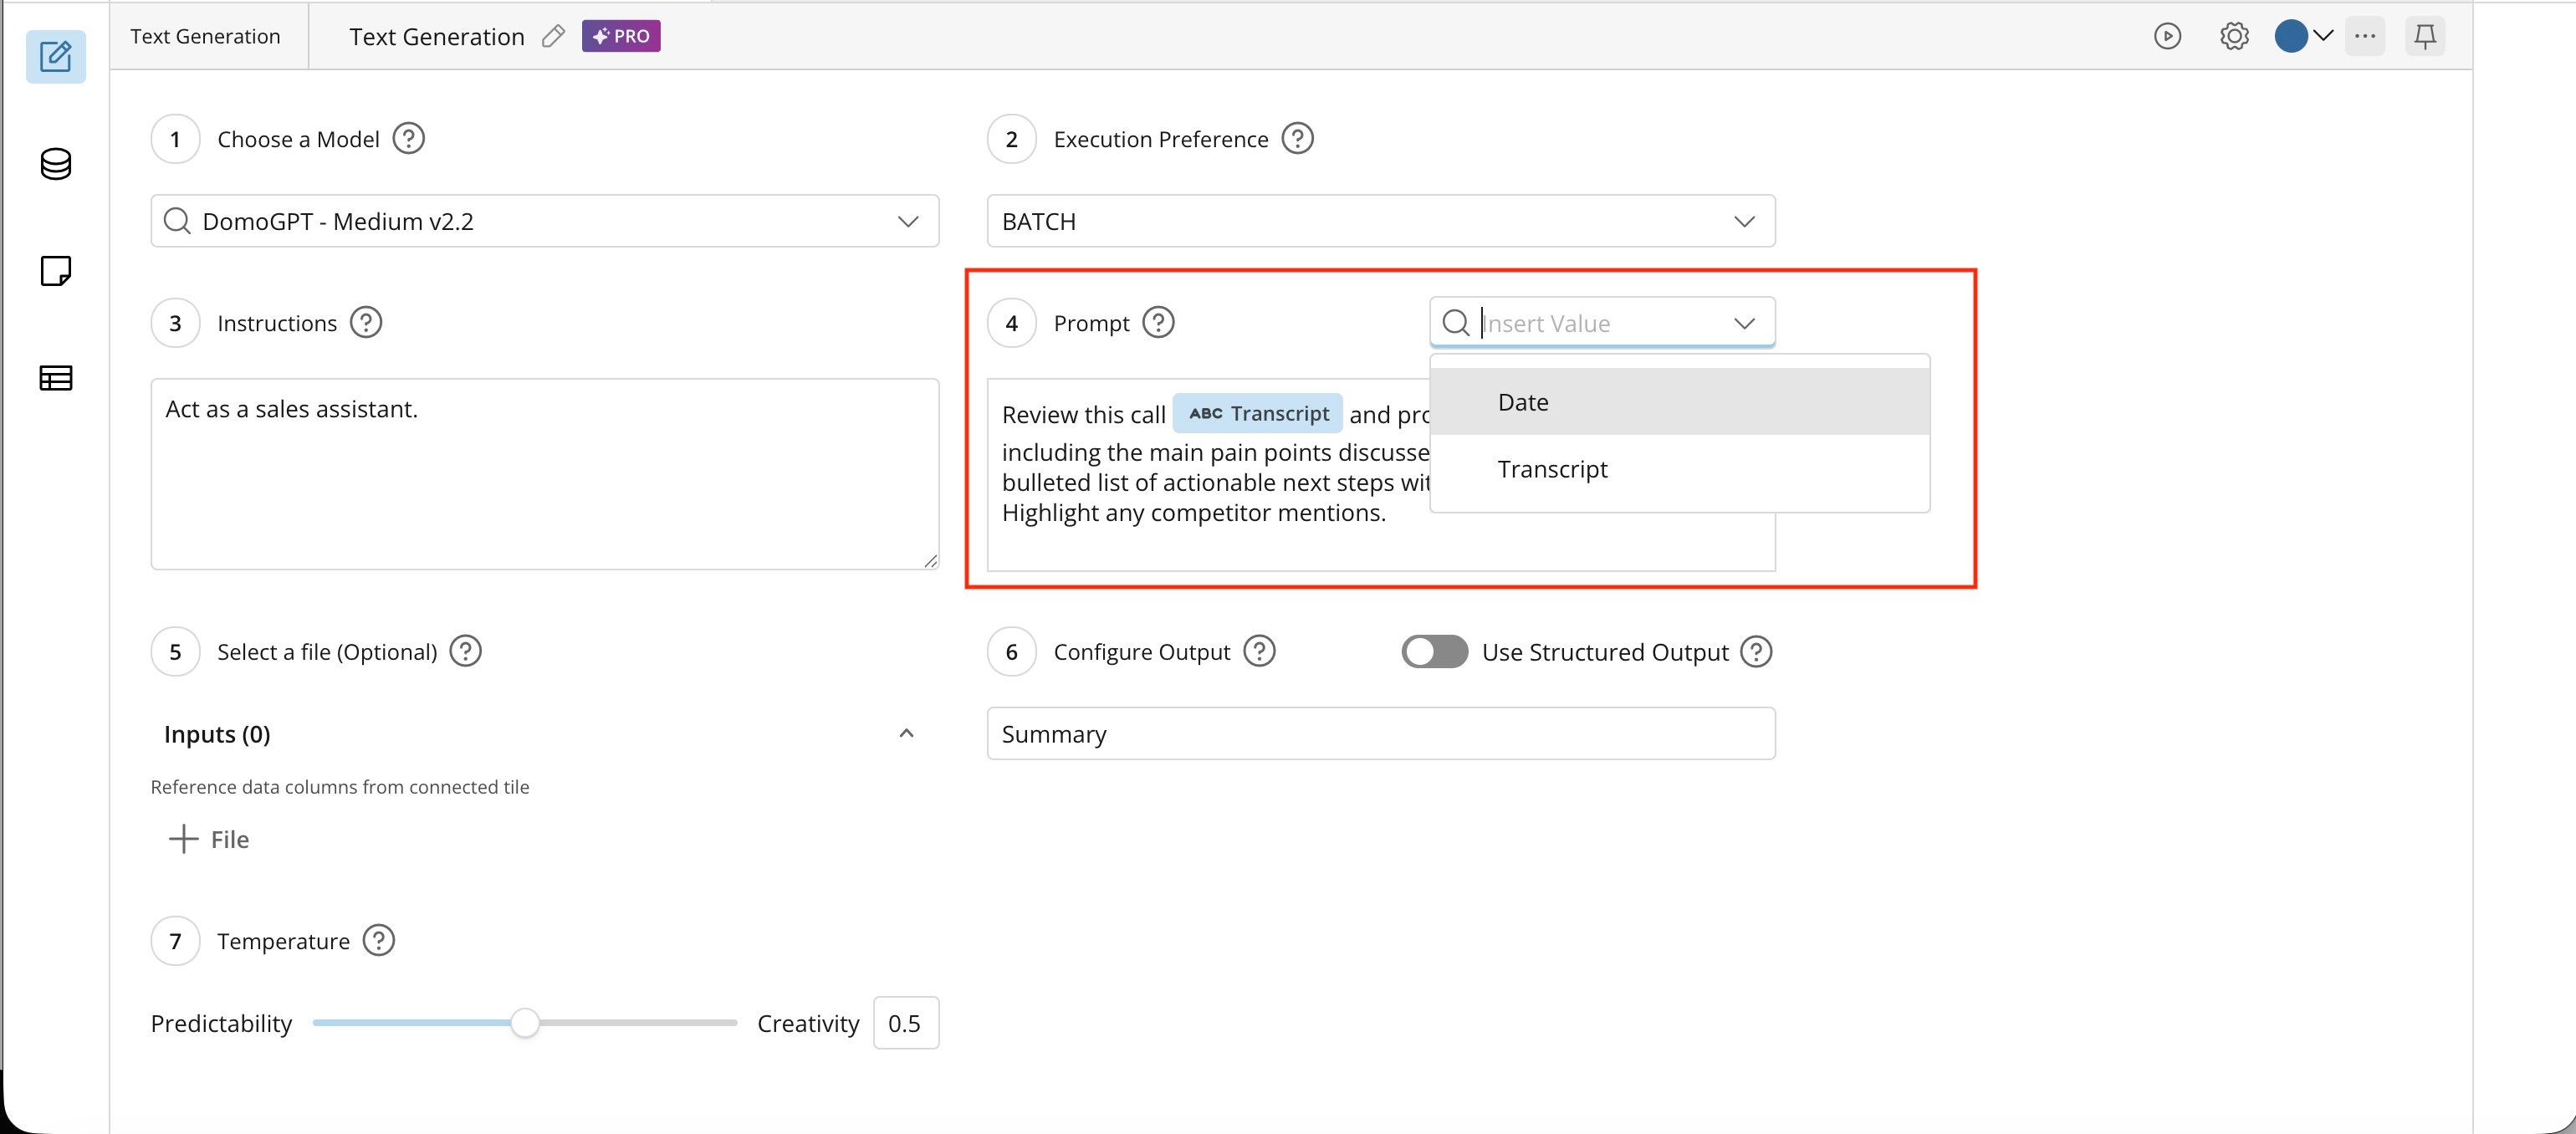
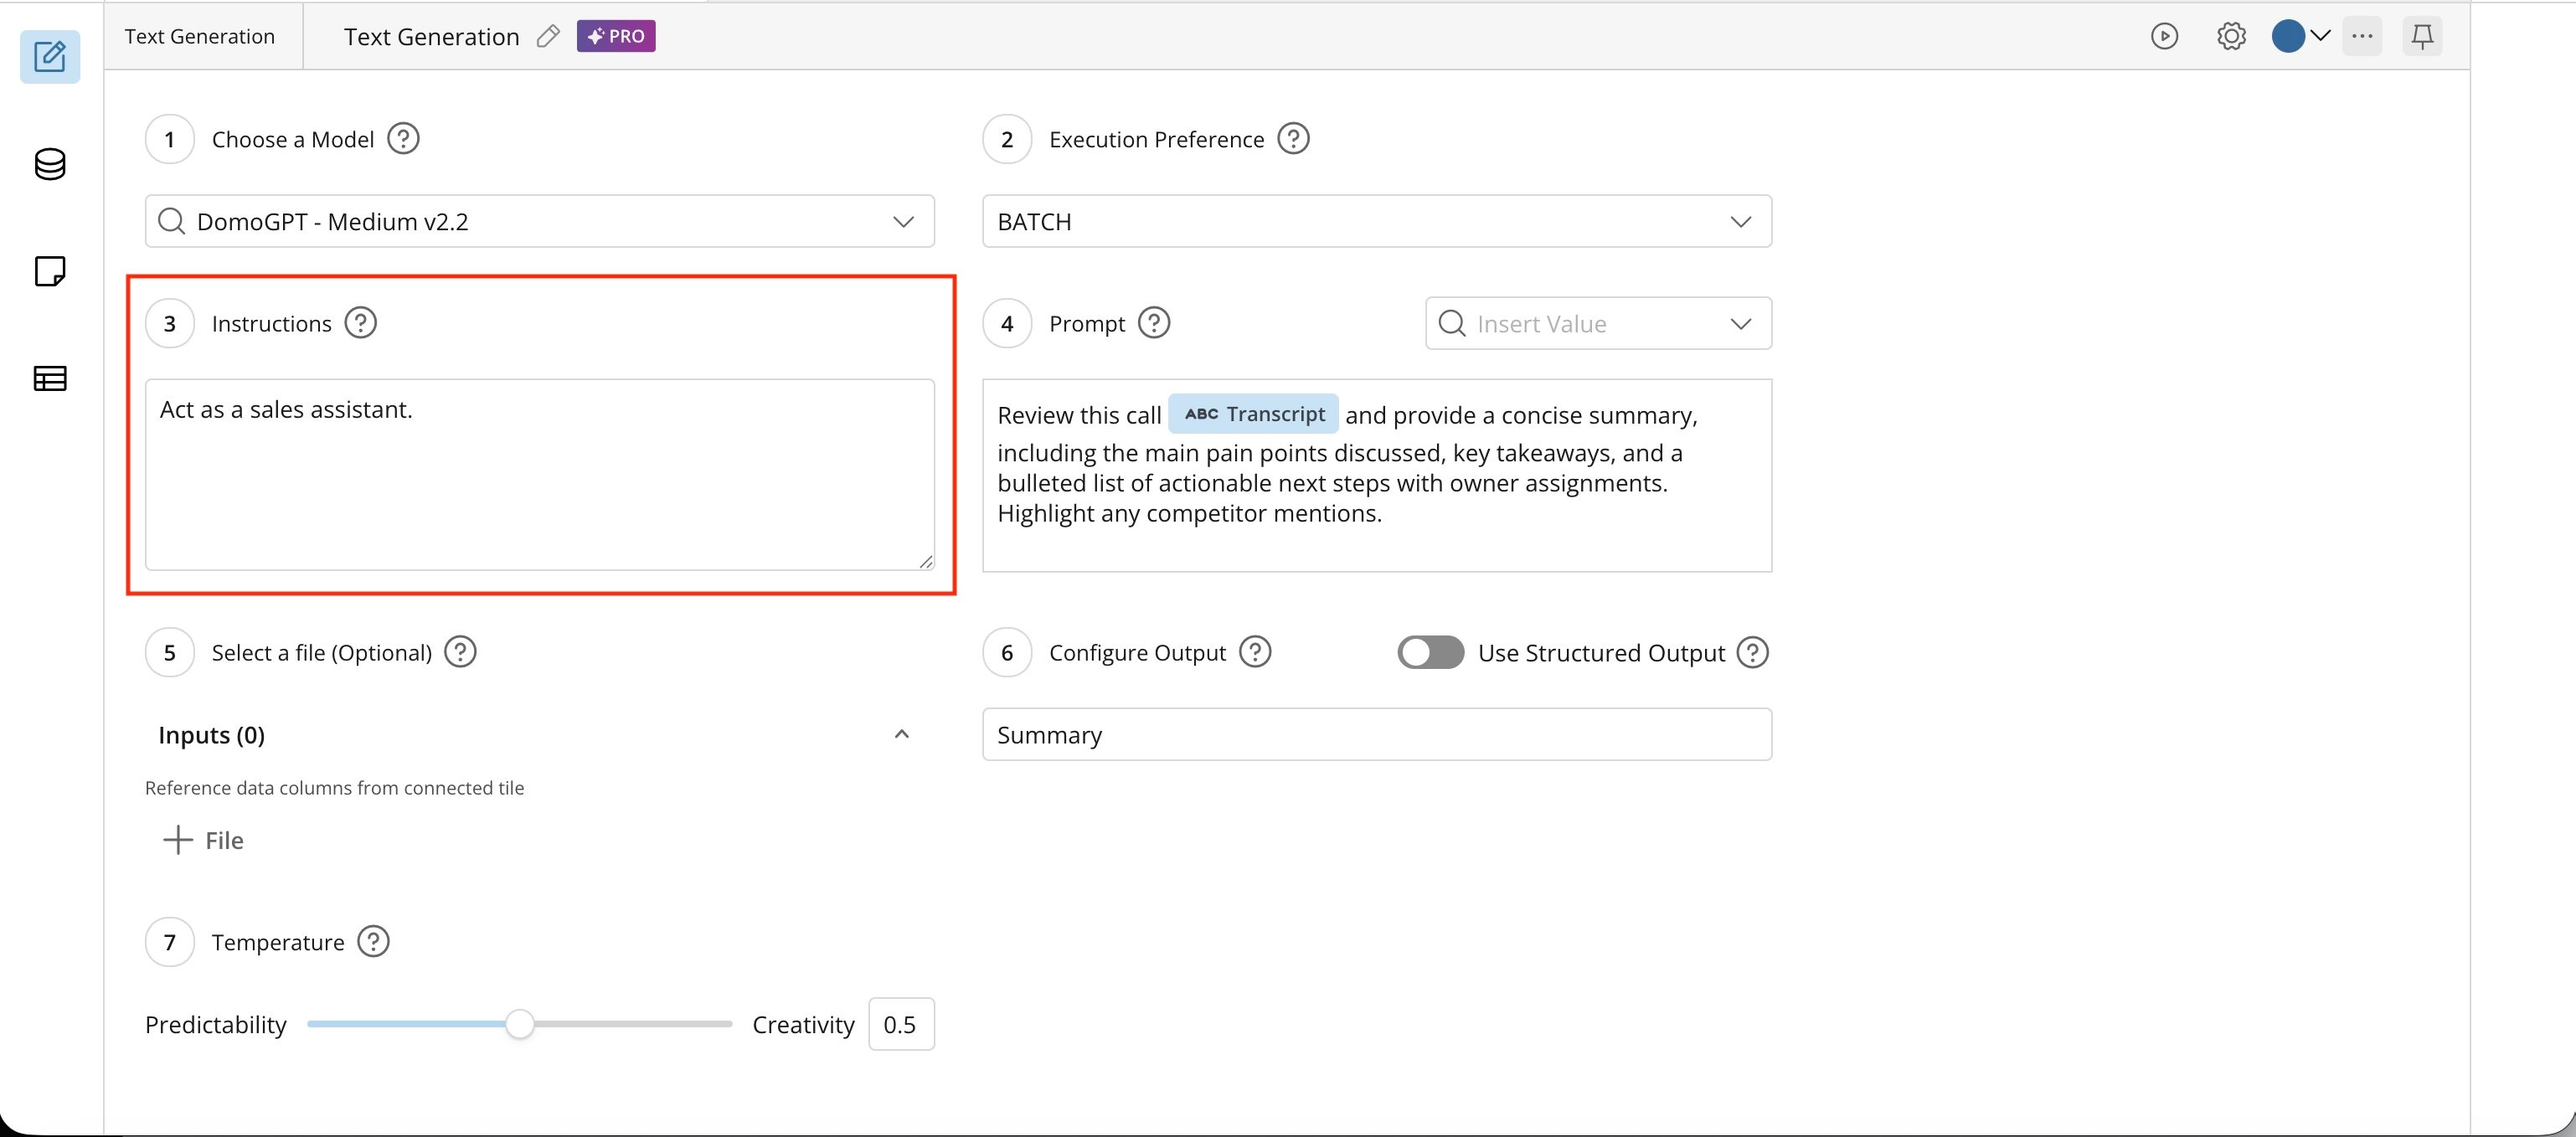 6\. Use the **Insert Value** dropdown to choose the column that contains the text
to be analyzed. You can also provide more details about what should be done with
the data.
6\. Use the **Insert Value** dropdown to choose the column that contains the text
to be analyzed. You can also provide more details about what should be done with
the data.
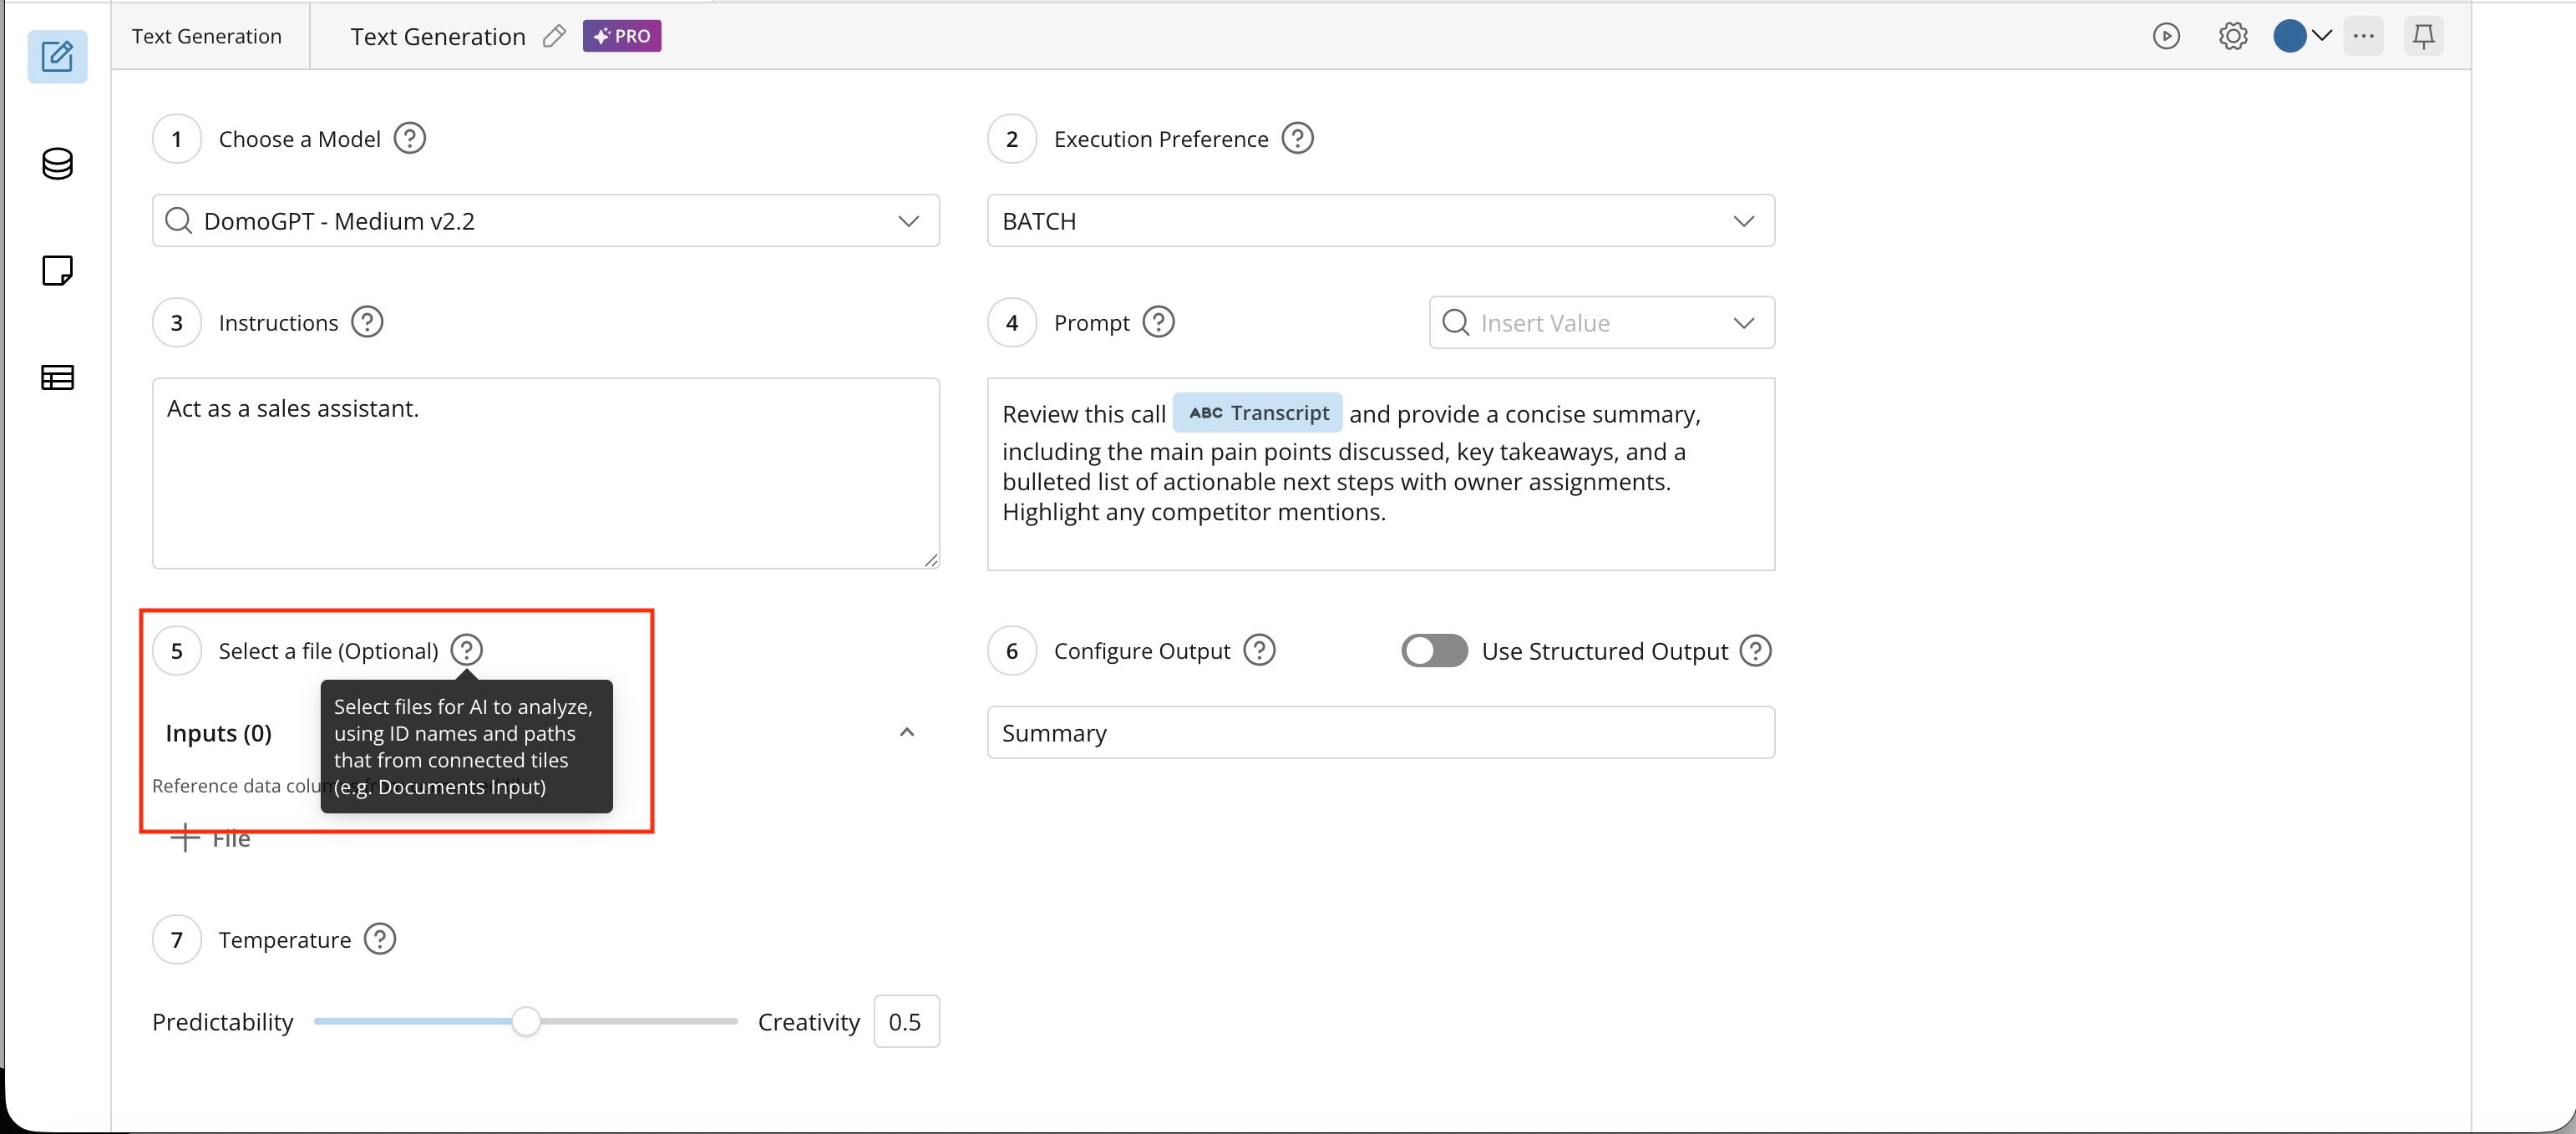
 7\. If needed, choose additional Knowledge.
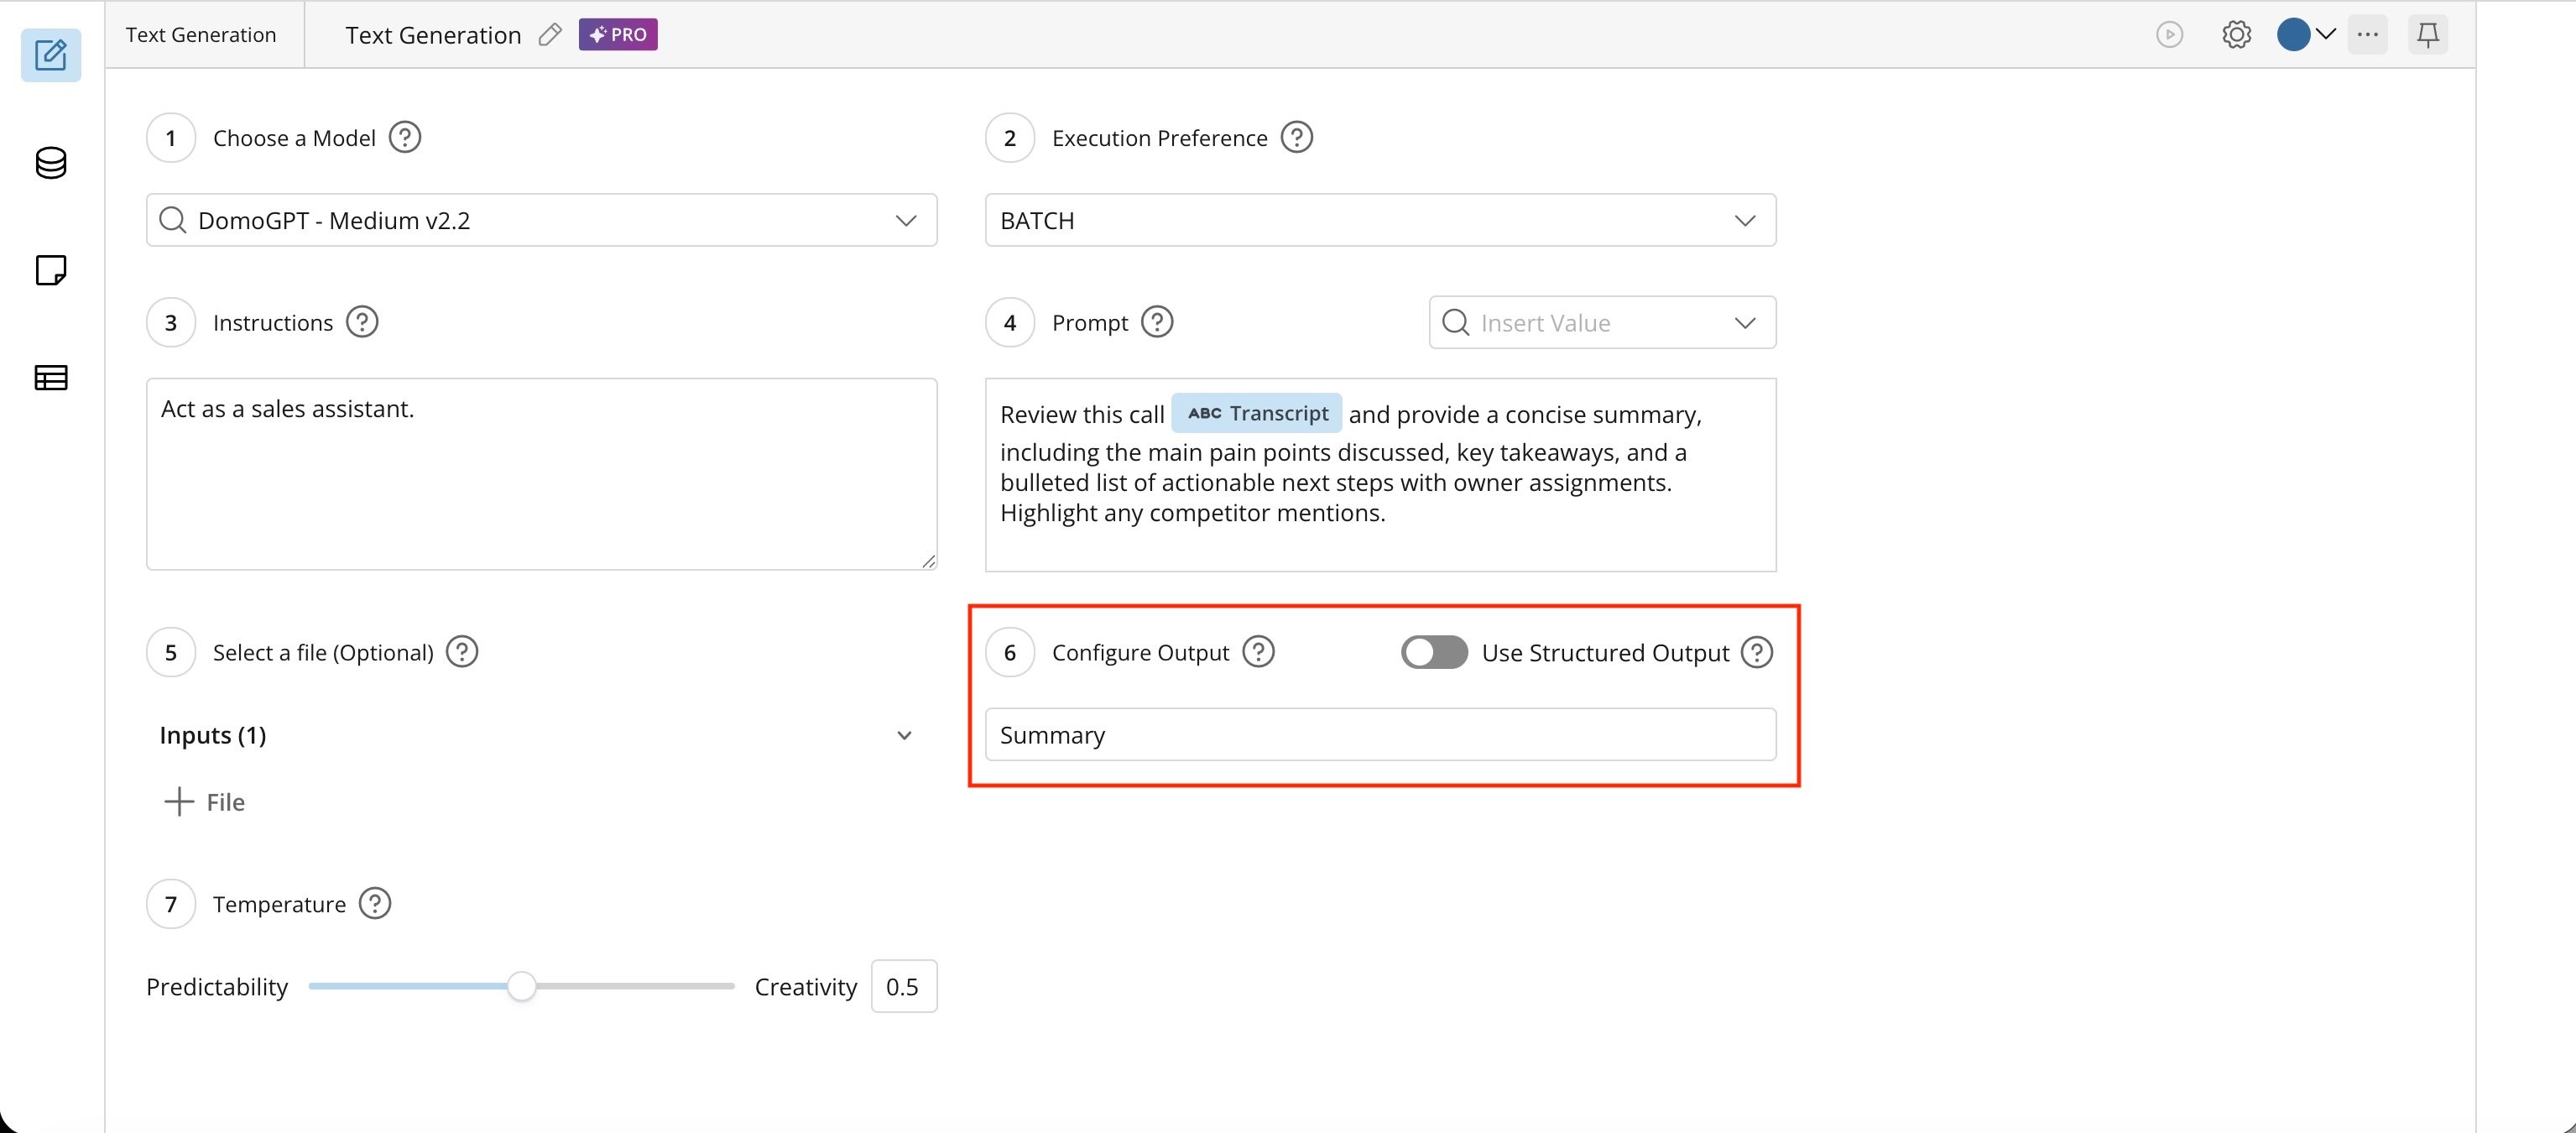
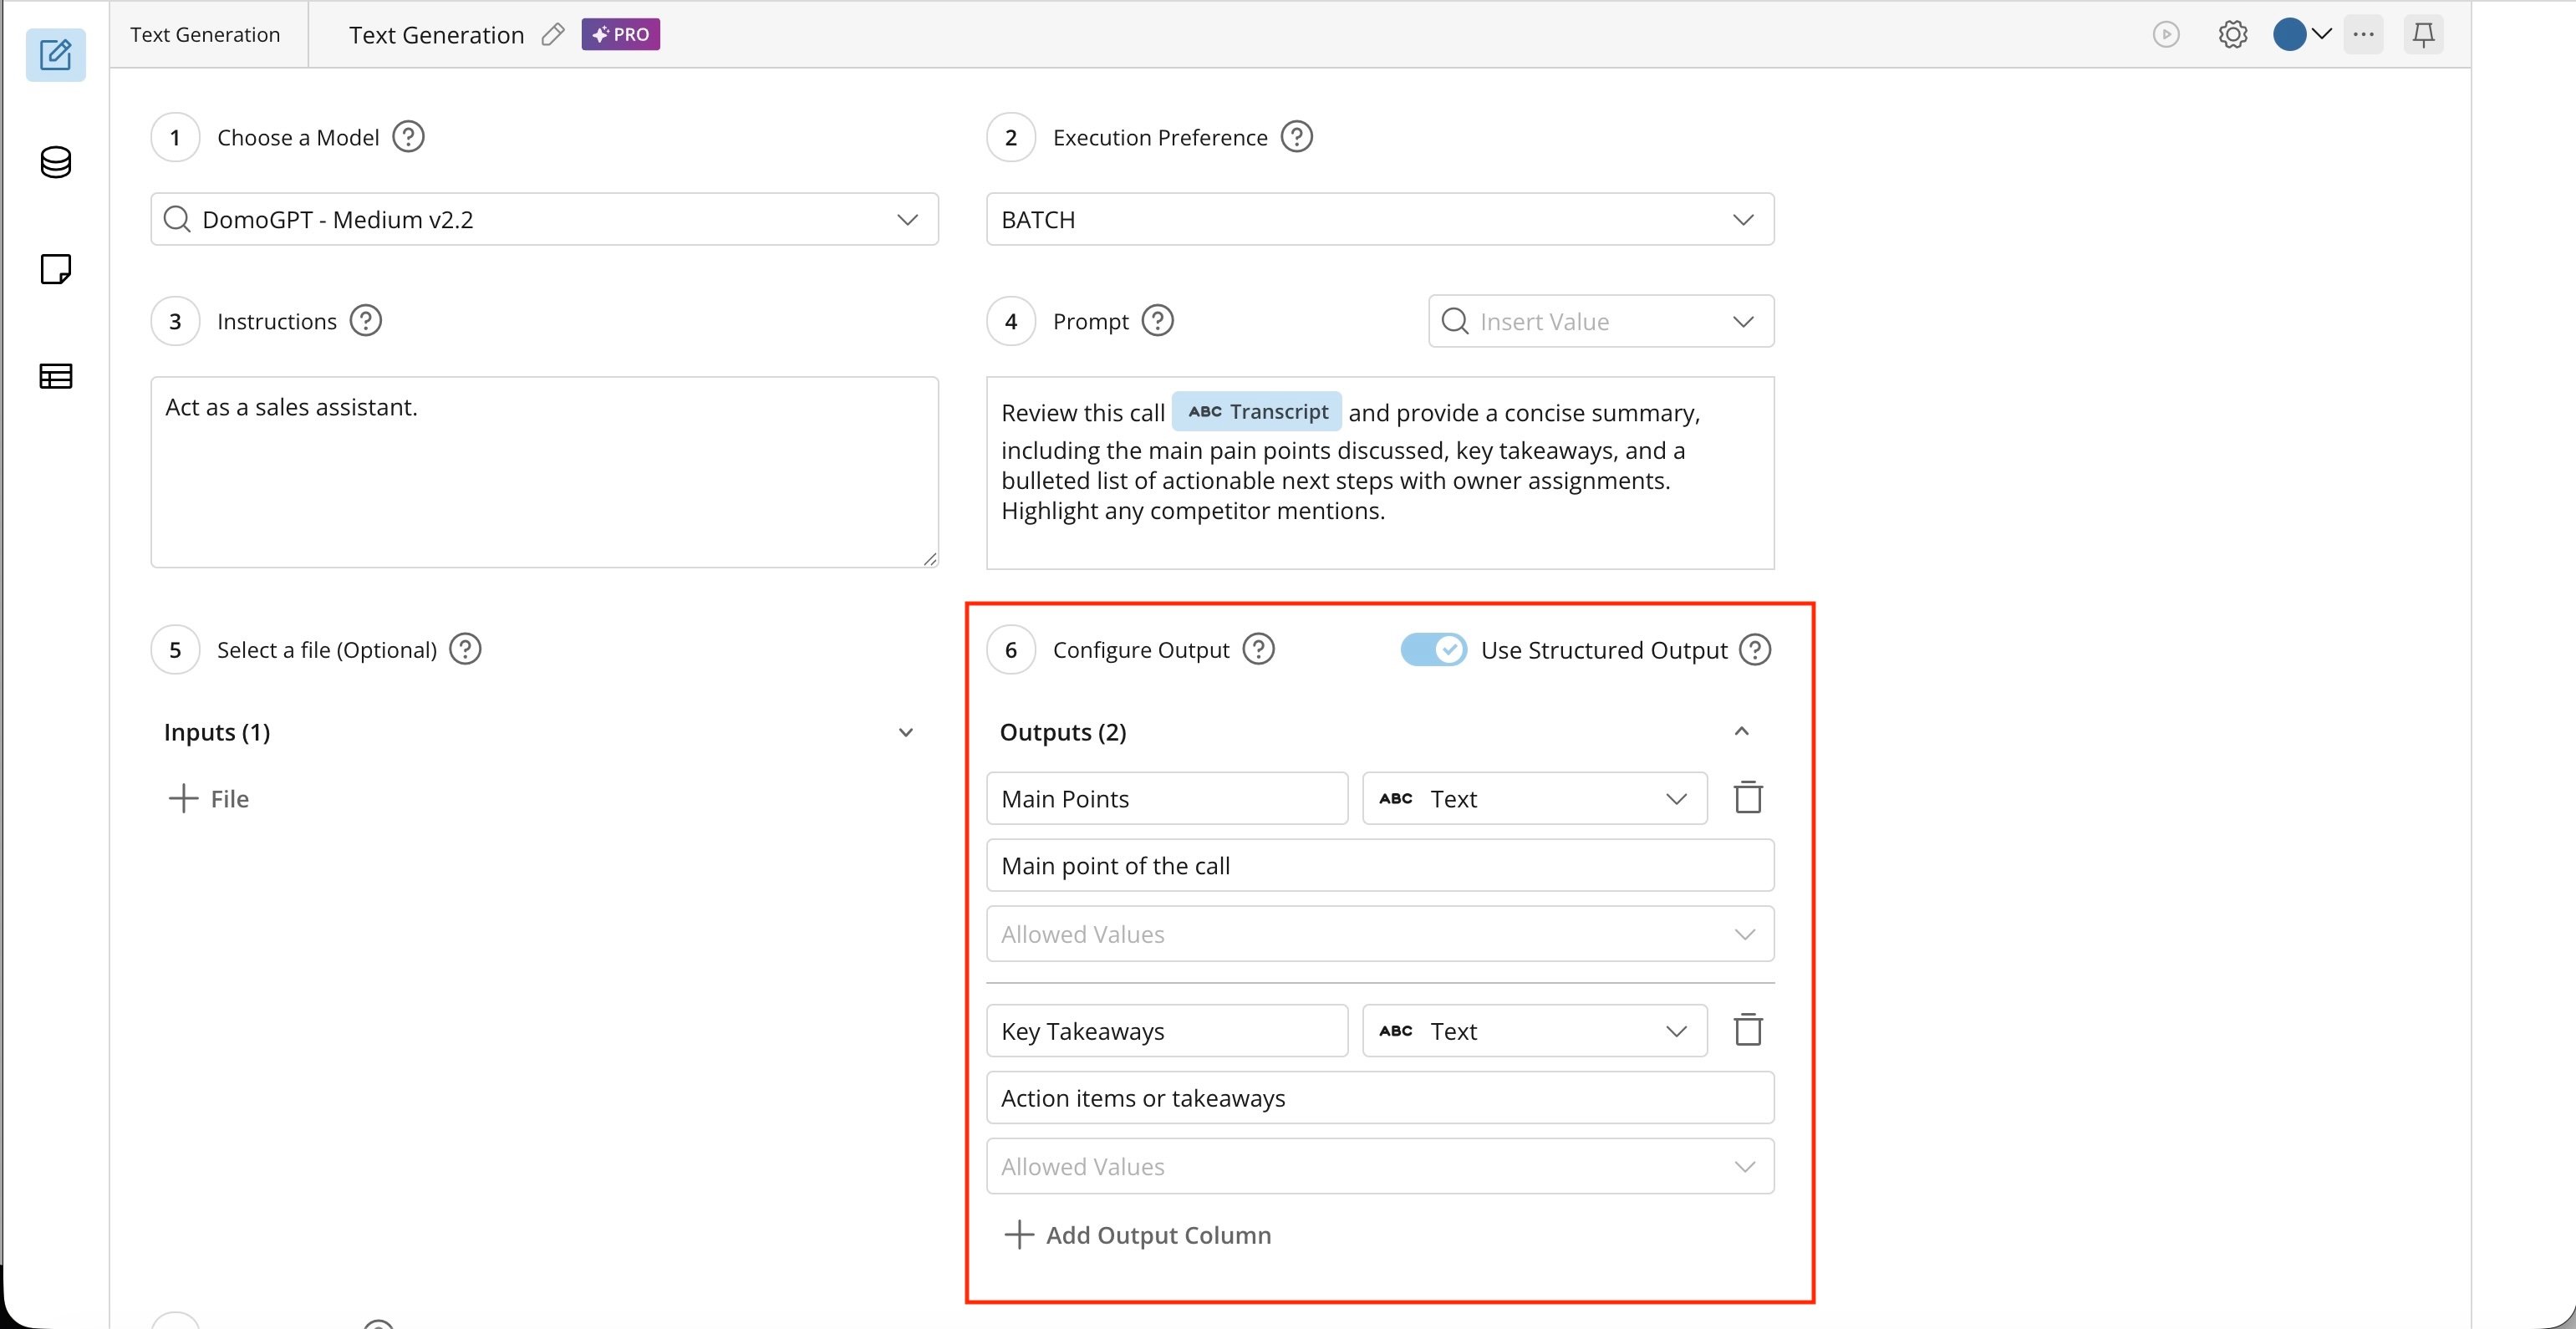
 8\. Configure the desired output. Choose structured or unstructured output, and either a single column or multiple output columns—each with a name, type, and description.
 9\. Choose the temperature of your desired response. Lower values provide
more predictability, while higher values provide more creativity.
9\. Choose the temperature of your desired response. Lower values provide
more predictability, while higher values provide more creativity.
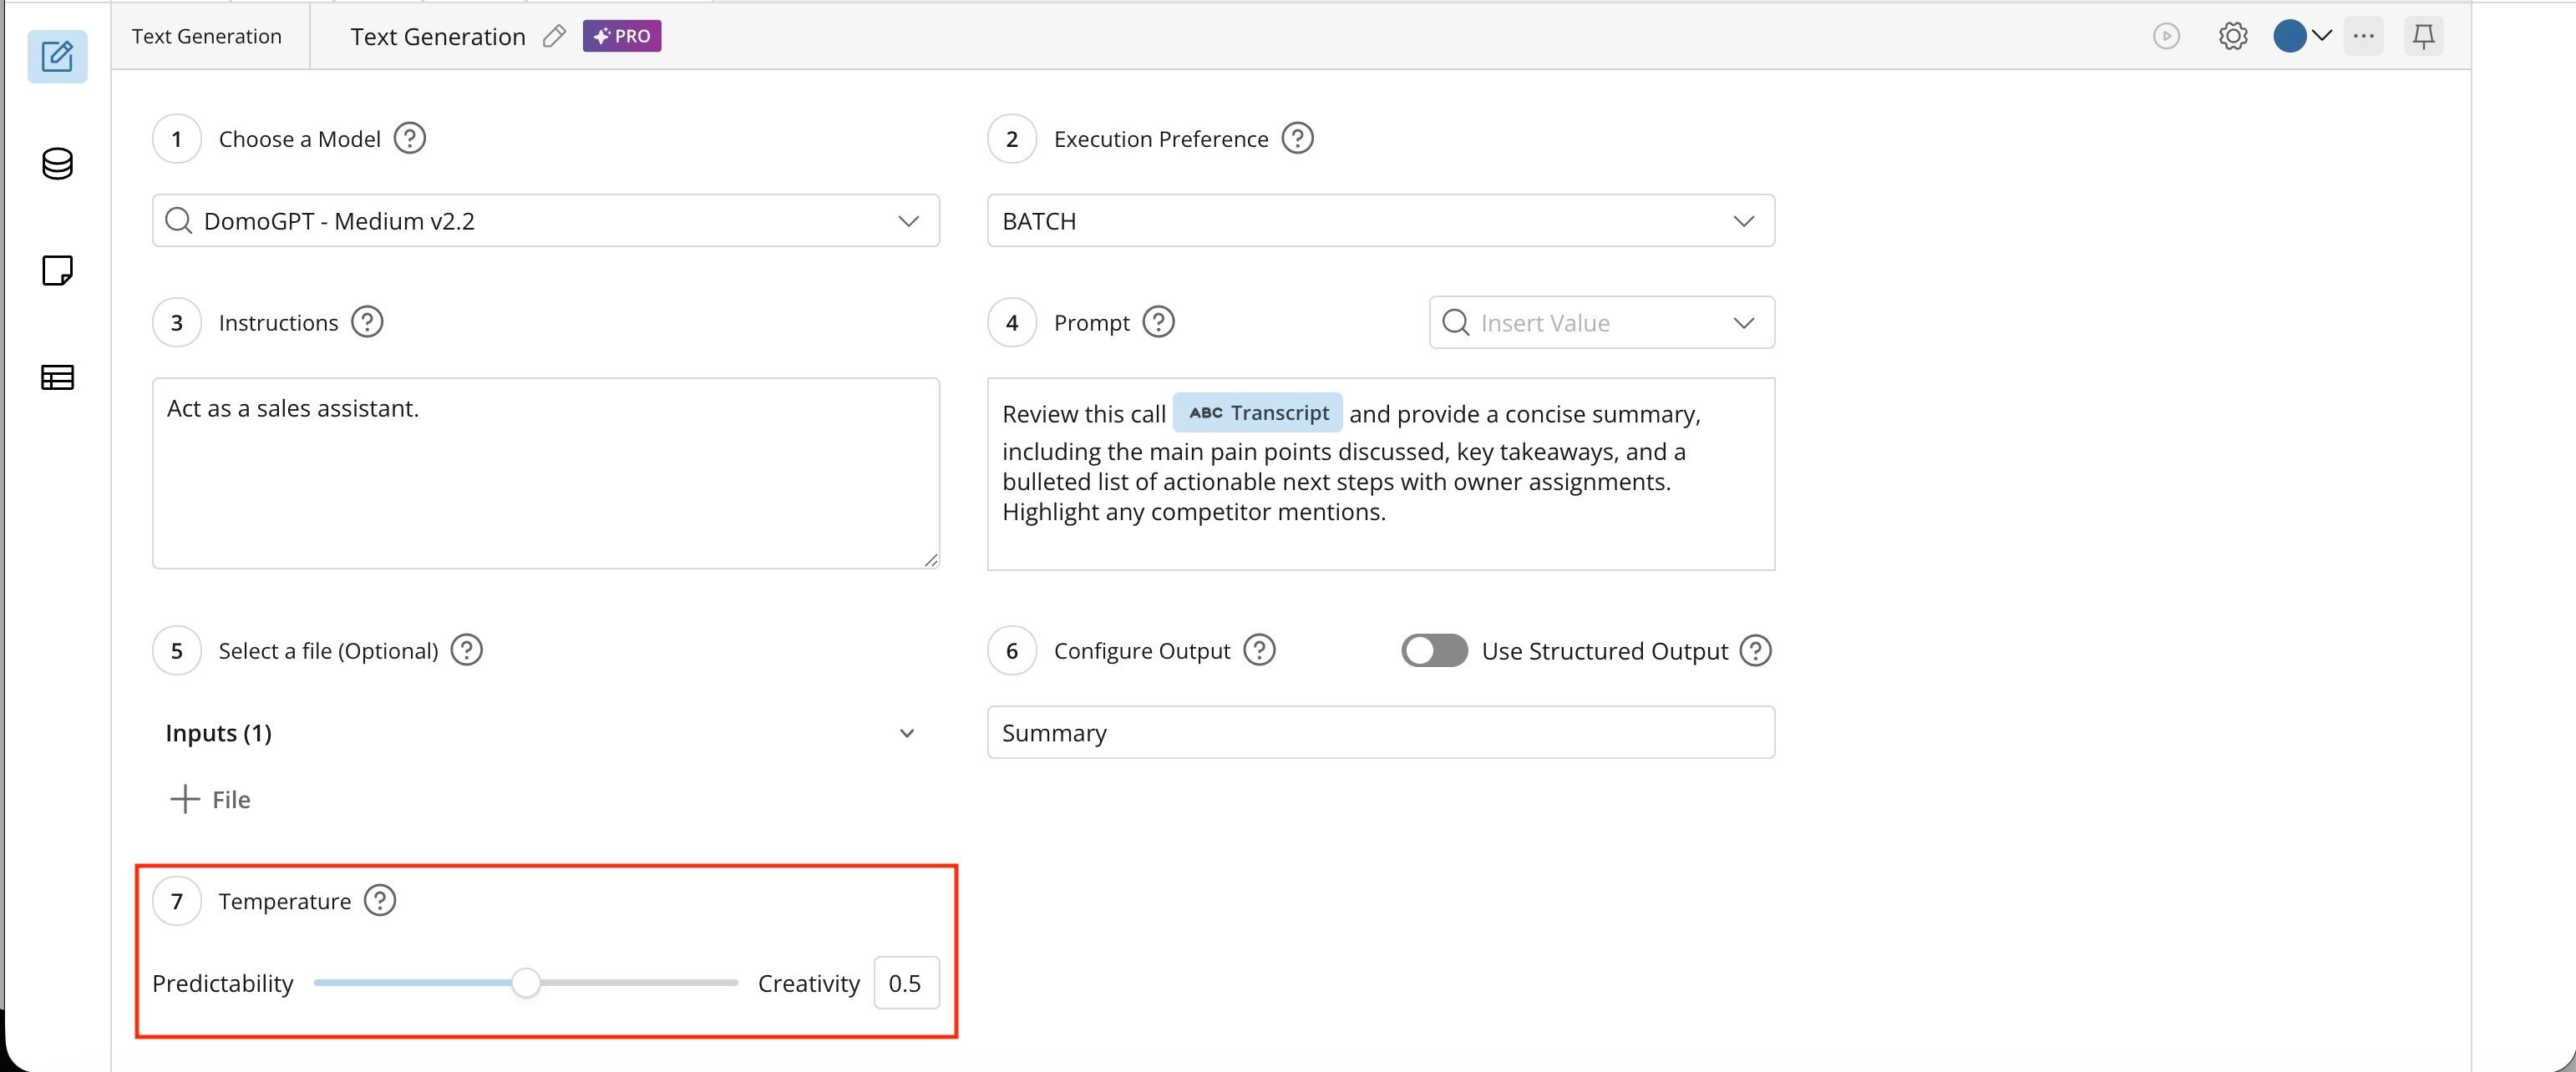 After the Text Generation tile executes, it adds a column to your DataSet named `Output`. You can use tiles farther downstream in the DataFlow to rename that column.
**Consumption Ramifications:**
* AI Operations: 1 operation per tile
* Tokens: input and output tokens vary based on the prompt and the data volume processed
**Notes:**
* You can include multiple Text Generation tiles in the same DataFlow, tasking them with different aspects of analysis for the column (or analysis of different columns).
* You can give multiple instructions in a single Text Generation tile, although you'll need a way to parse the results of the multiple instructions from the single output column.
For example, you could instruct the model to separate the output of each instruction with a specific delimiter and then use the Split Columns action to parse.
Here's an example of the output DataSet from a DataFlow leveraging multiple instances of the Text Generation tile to analyze language, translate the review to English, analyze sentiment, and categorize the review based on provided themes.
After the Text Generation tile executes, it adds a column to your DataSet named `Output`. You can use tiles farther downstream in the DataFlow to rename that column.
**Consumption Ramifications:**
* AI Operations: 1 operation per tile
* Tokens: input and output tokens vary based on the prompt and the data volume processed
**Notes:**
* You can include multiple Text Generation tiles in the same DataFlow, tasking them with different aspects of analysis for the column (or analysis of different columns).
* You can give multiple instructions in a single Text Generation tile, although you'll need a way to parse the results of the multiple instructions from the single output column.
For example, you could instruct the model to separate the output of each instruction with a specific delimiter and then use the Split Columns action to parse.
Here's an example of the output DataSet from a DataFlow leveraging multiple instances of the Text Generation tile to analyze language, translate the review to English, analyze sentiment, and categorize the review based on provided themes.
 ## FAQ
Not currently, but this capability is on the roadmap.
Yes, you can enable Structure Output.
## Classification Tile Beta
## FAQ
Not currently, but this capability is on the roadmap.
Yes, you can enable Structure Output.
## Classification Tile Beta
 The Classification tile categorizes data—text, images, or files—into predefined classes. Because the tile comes pre-configured for classification, you can focus on your classification entities instead of configuration details. It's faster and easier to configure and use than the Text Generation tile for classification.
### Required Grants
To access the Classification tile in Magic ETL, the following grants must be enabled for your role:
* Execute AutoML
* Create AI Service Models
* Use AI Services
Learn more about [grants](/s/article/360043438973).
**Important:** You must also have AI Services enabled and the ability to
create a DataFlow. Learn how to [create a DataFlow](/s/article/360055259234).
### Configure the Classification Tile
1. Open the Magic ETL canvas and choose an input DataSet that contains a text column you want to analyze.
**Important:** Due to an AWS limitation, if the DataSet you choose has fewer than 100 rows, the
system automatically switches to non-batch mode.
The Classification tile categorizes data—text, images, or files—into predefined classes. Because the tile comes pre-configured for classification, you can focus on your classification entities instead of configuration details. It's faster and easier to configure and use than the Text Generation tile for classification.
### Required Grants
To access the Classification tile in Magic ETL, the following grants must be enabled for your role:
* Execute AutoML
* Create AI Service Models
* Use AI Services
Learn more about [grants](/s/article/360043438973).
**Important:** You must also have AI Services enabled and the ability to
create a DataFlow. Learn how to [create a DataFlow](/s/article/360055259234).
### Configure the Classification Tile
1. Open the Magic ETL canvas and choose an input DataSet that contains a text column you want to analyze.
**Important:** Due to an AWS limitation, if the DataSet you choose has fewer than 100 rows, the
system automatically switches to non-batch mode.
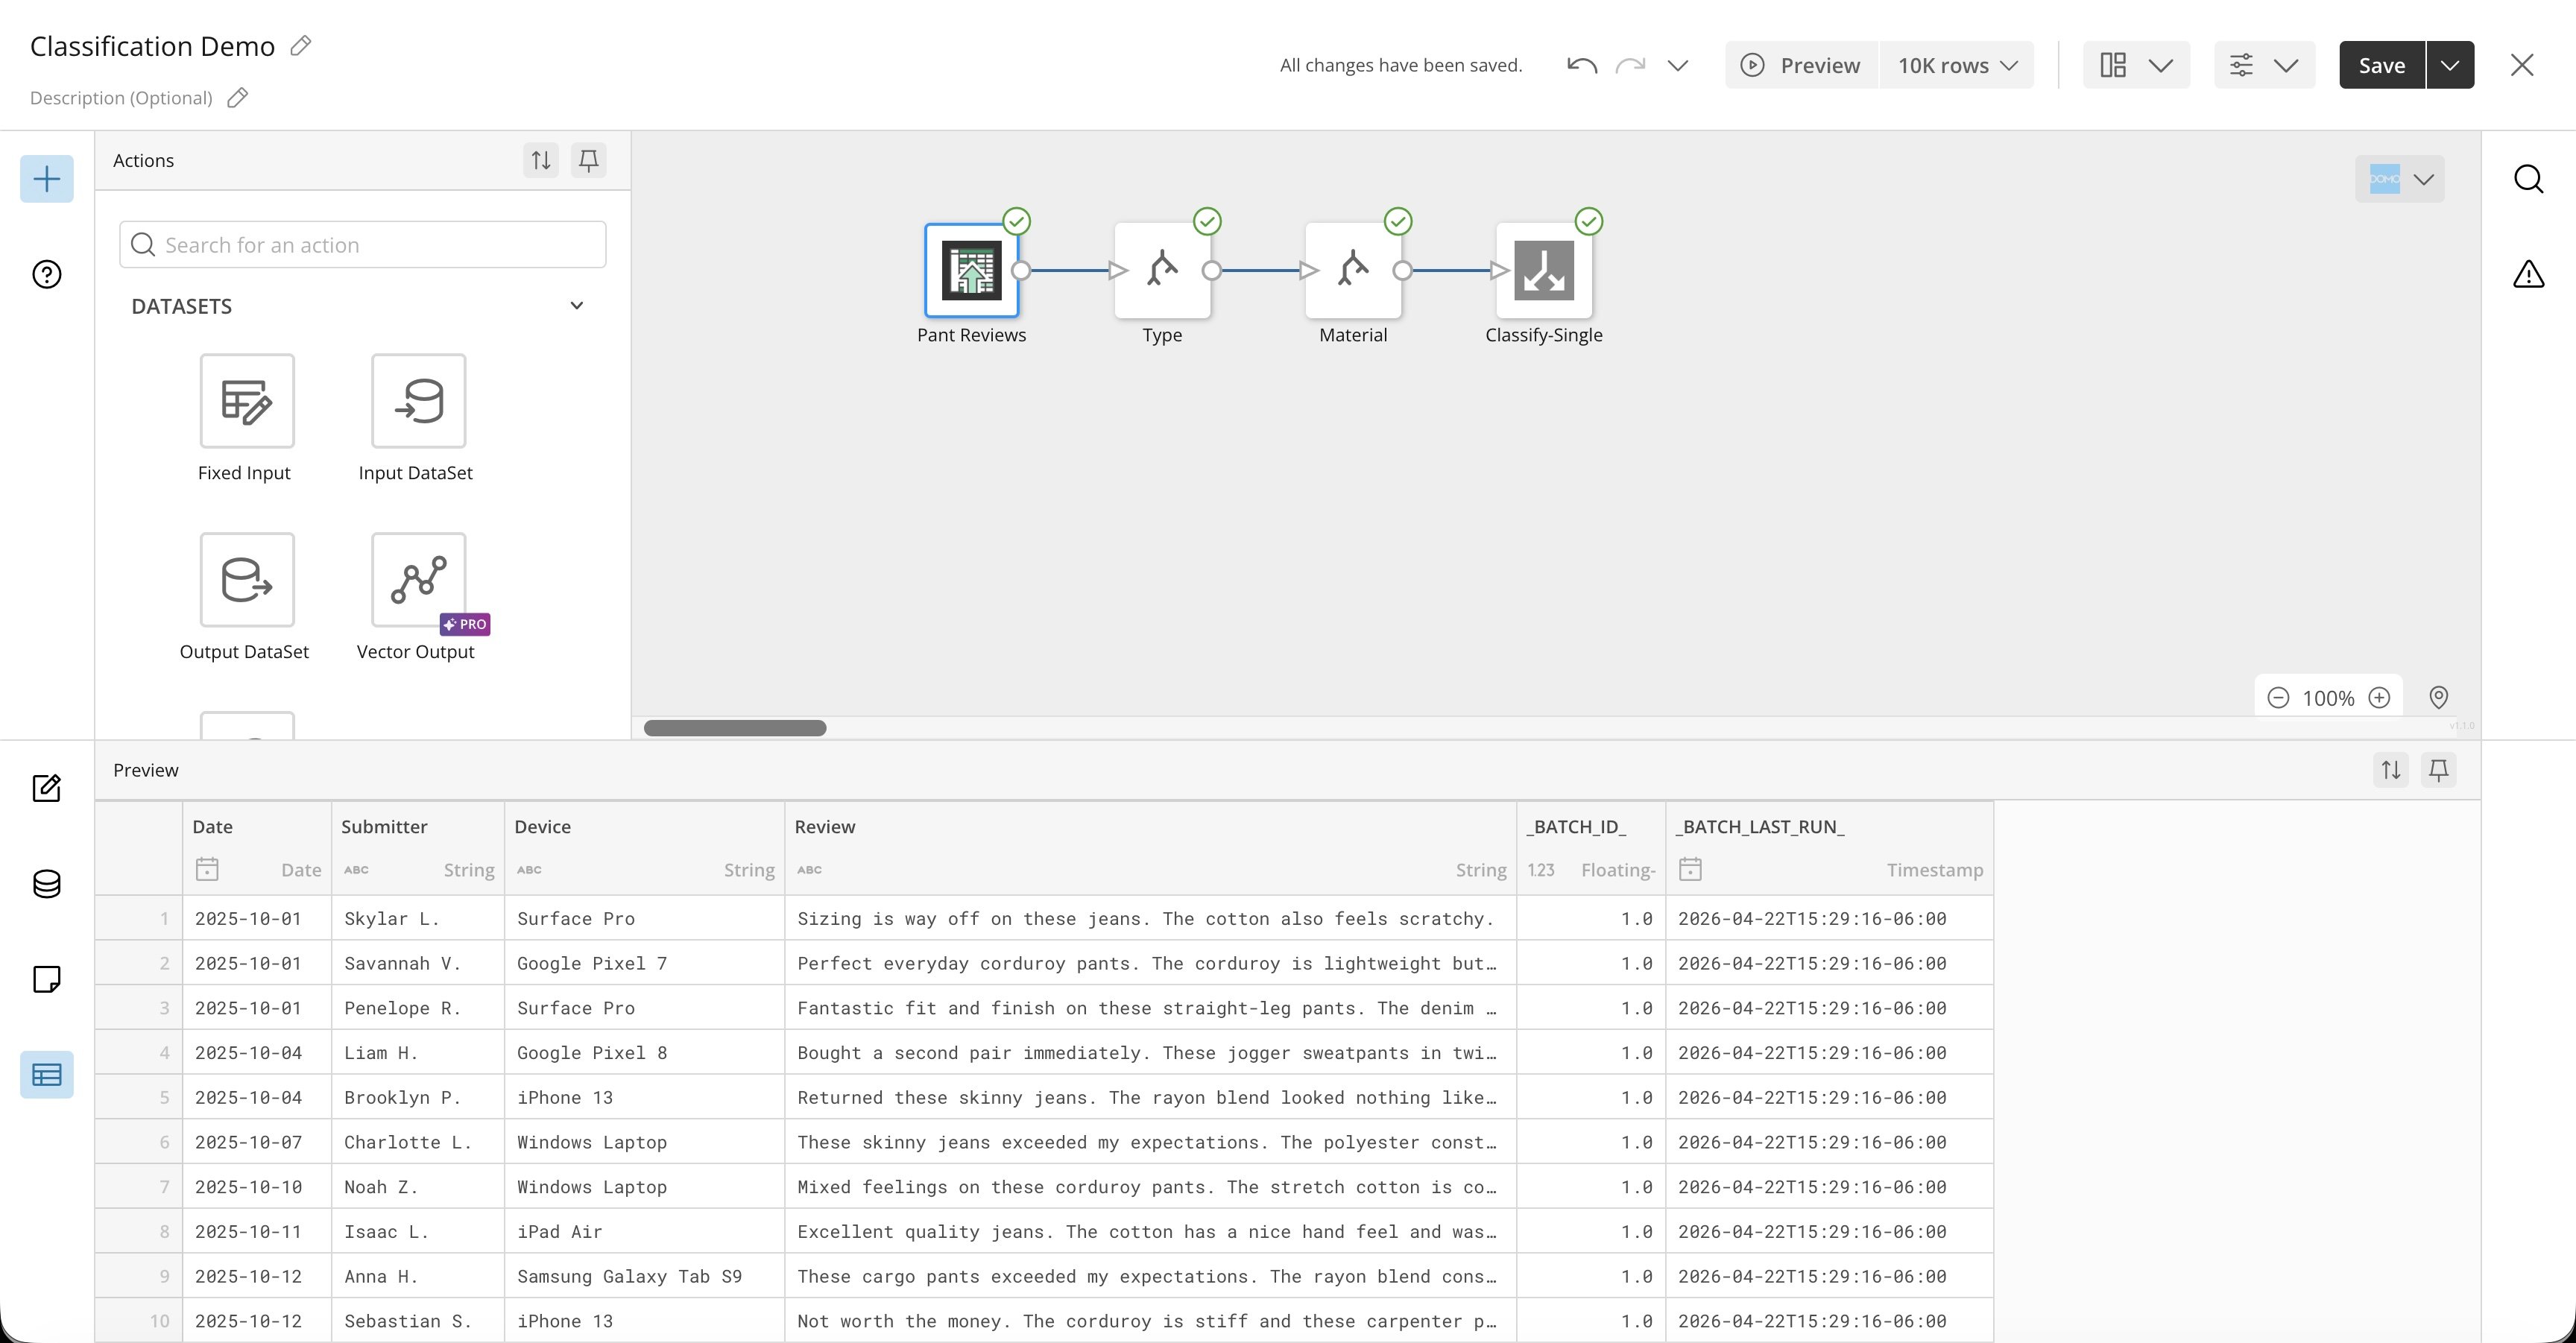 2\. Under **AI Services** in the left drawer, drag a Classification tile to the
canvas. The tile editor expands below the canvas.
2\. Under **AI Services** in the left drawer, drag a Classification tile to the
canvas. The tile editor expands below the canvas.
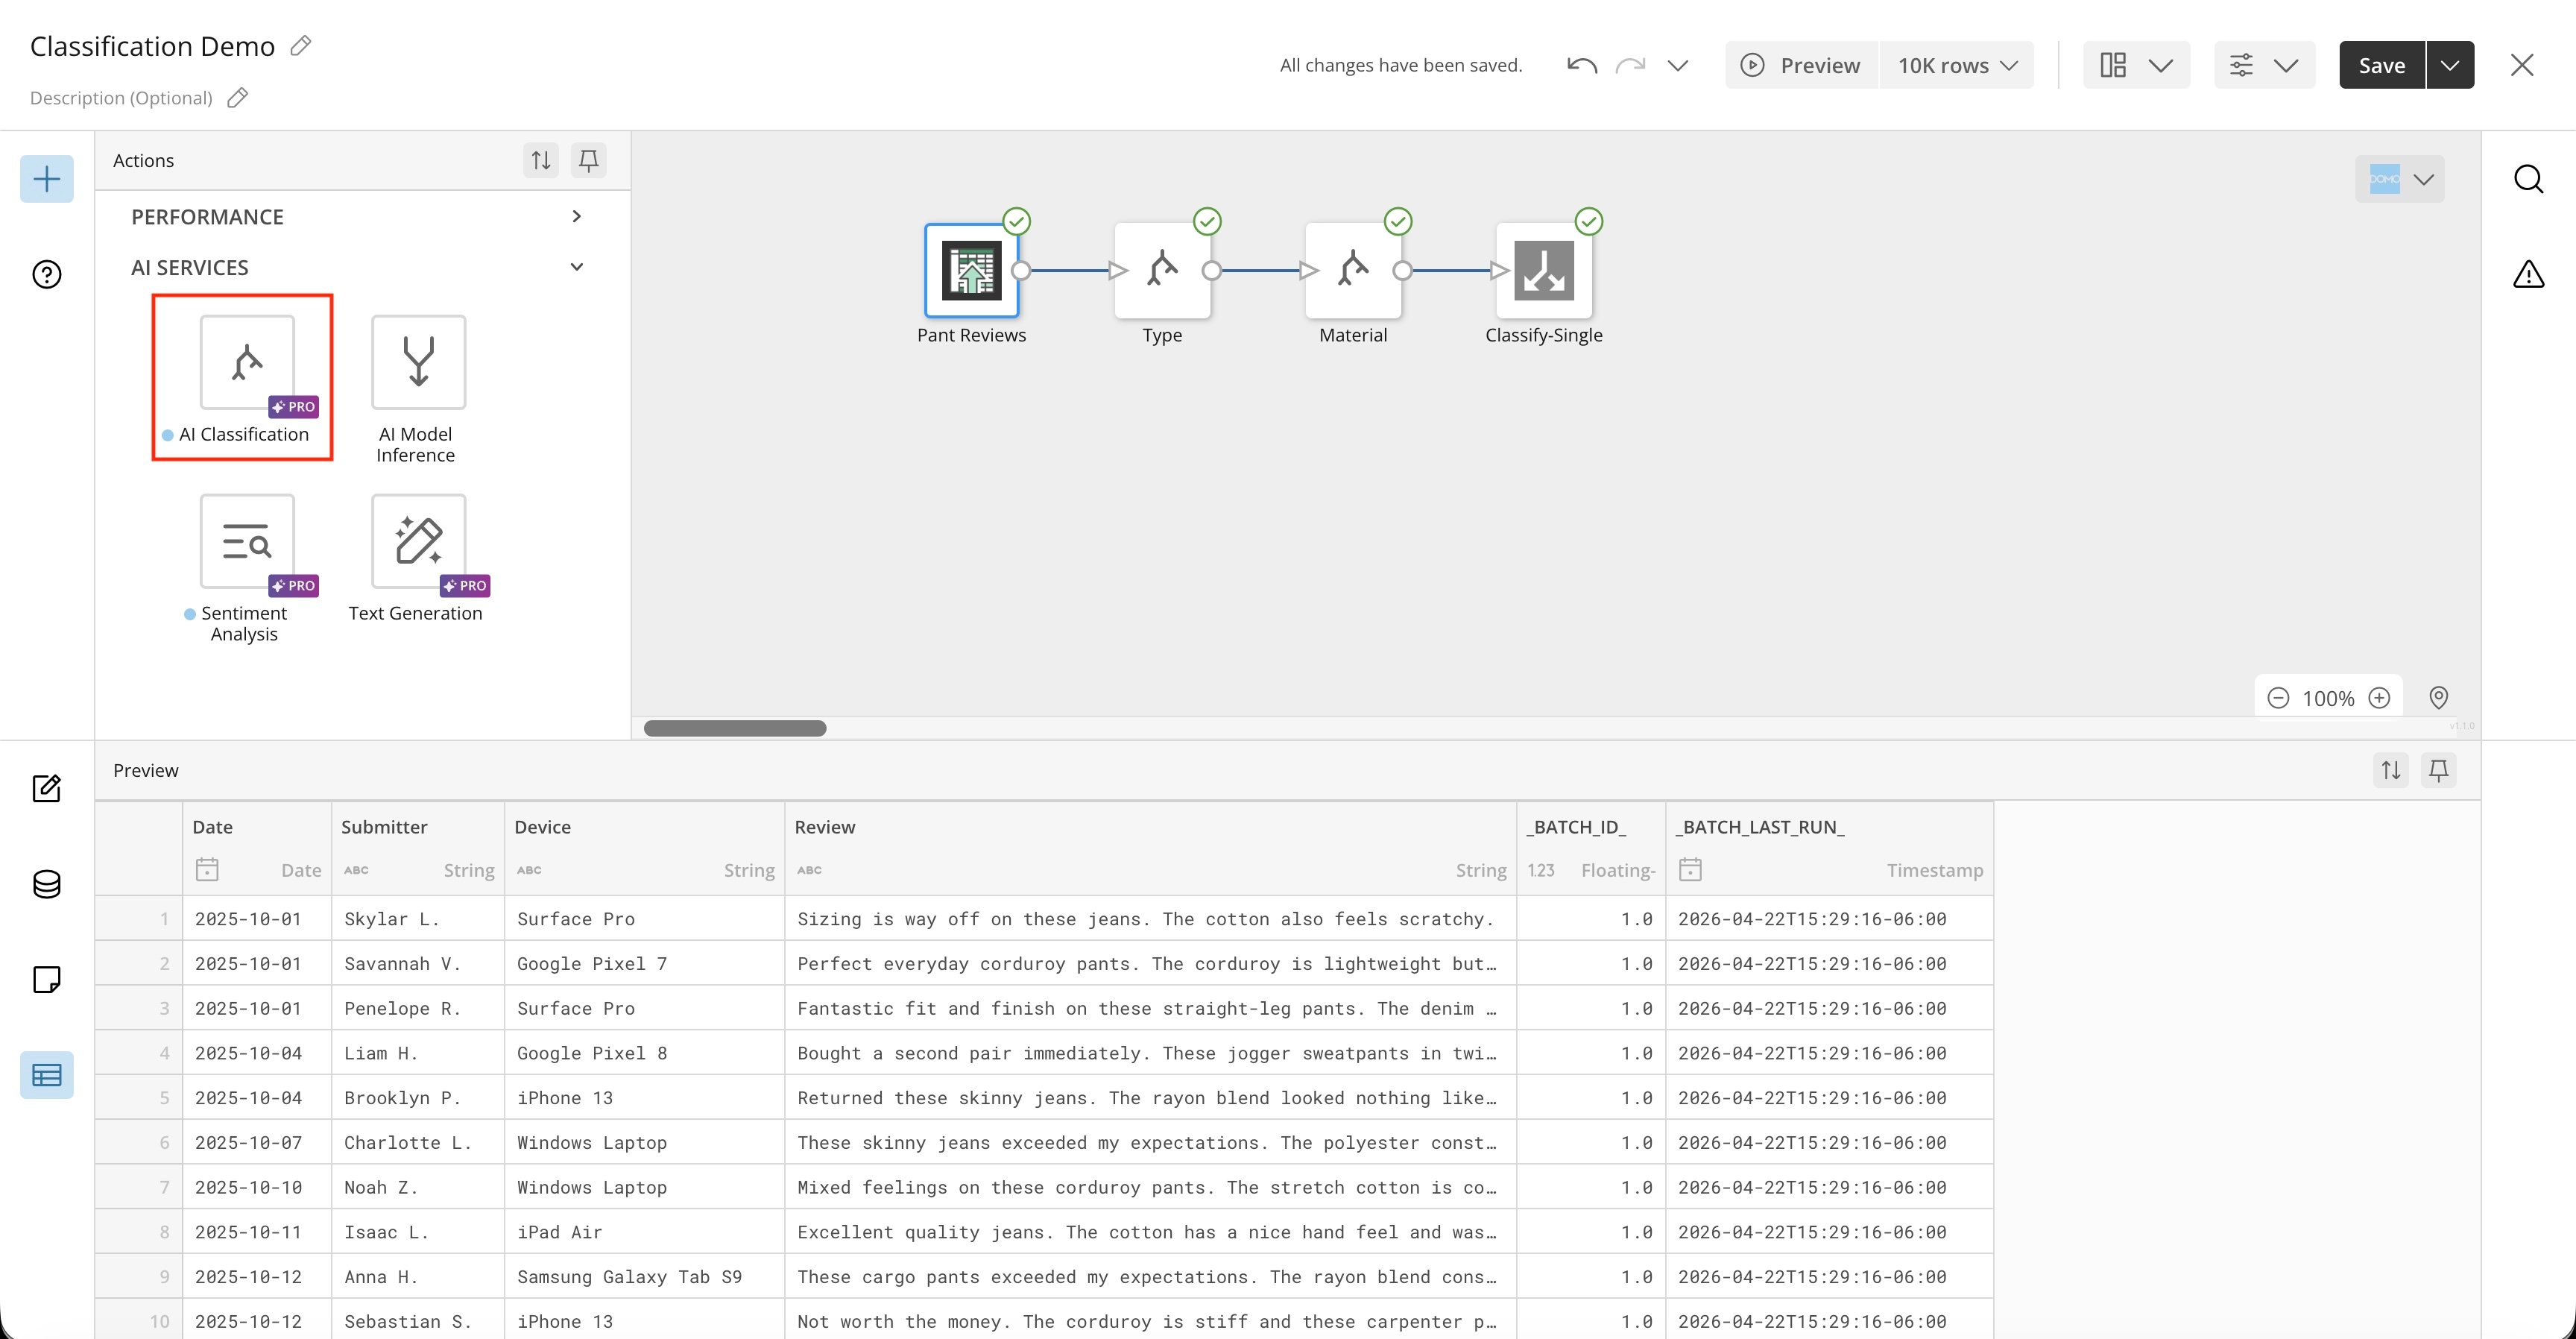 3\. In the tile editor, choose the input data—**Data Column** or **Documents**.
If the data you want to classify is already in a data column, select the column from the selector.
3\. In the tile editor, choose the input data—**Data Column** or **Documents**.
If the data you want to classify is already in a data column, select the column from the selector.
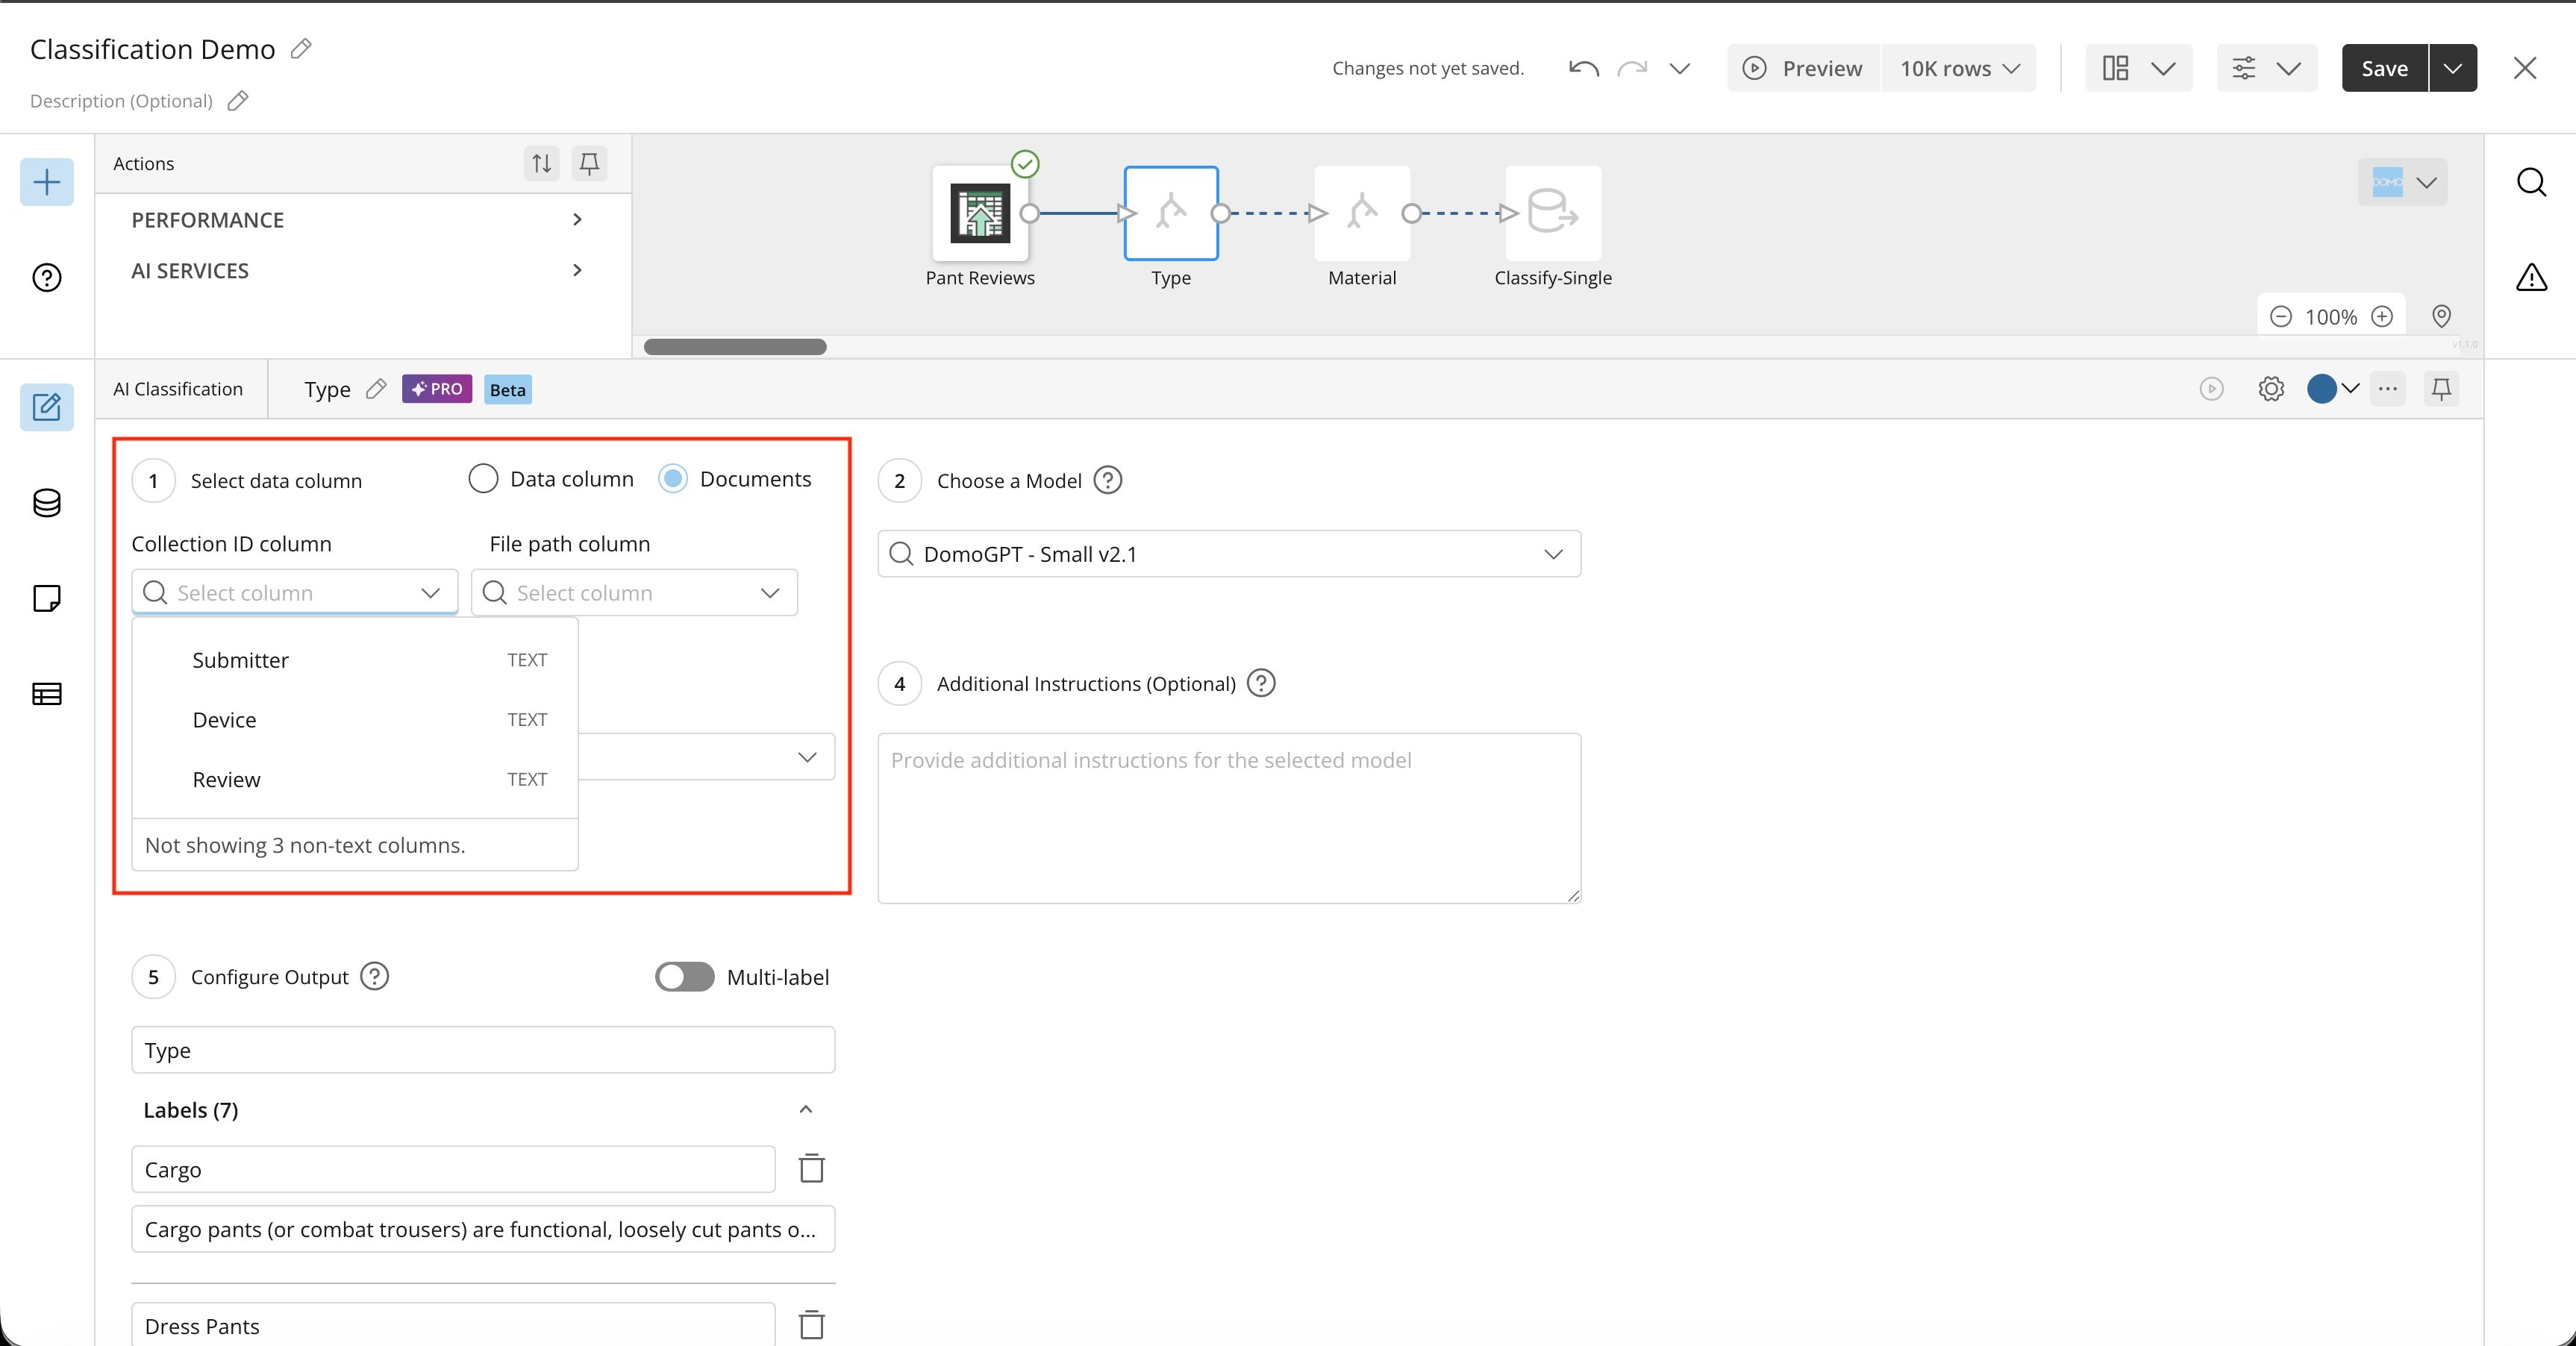
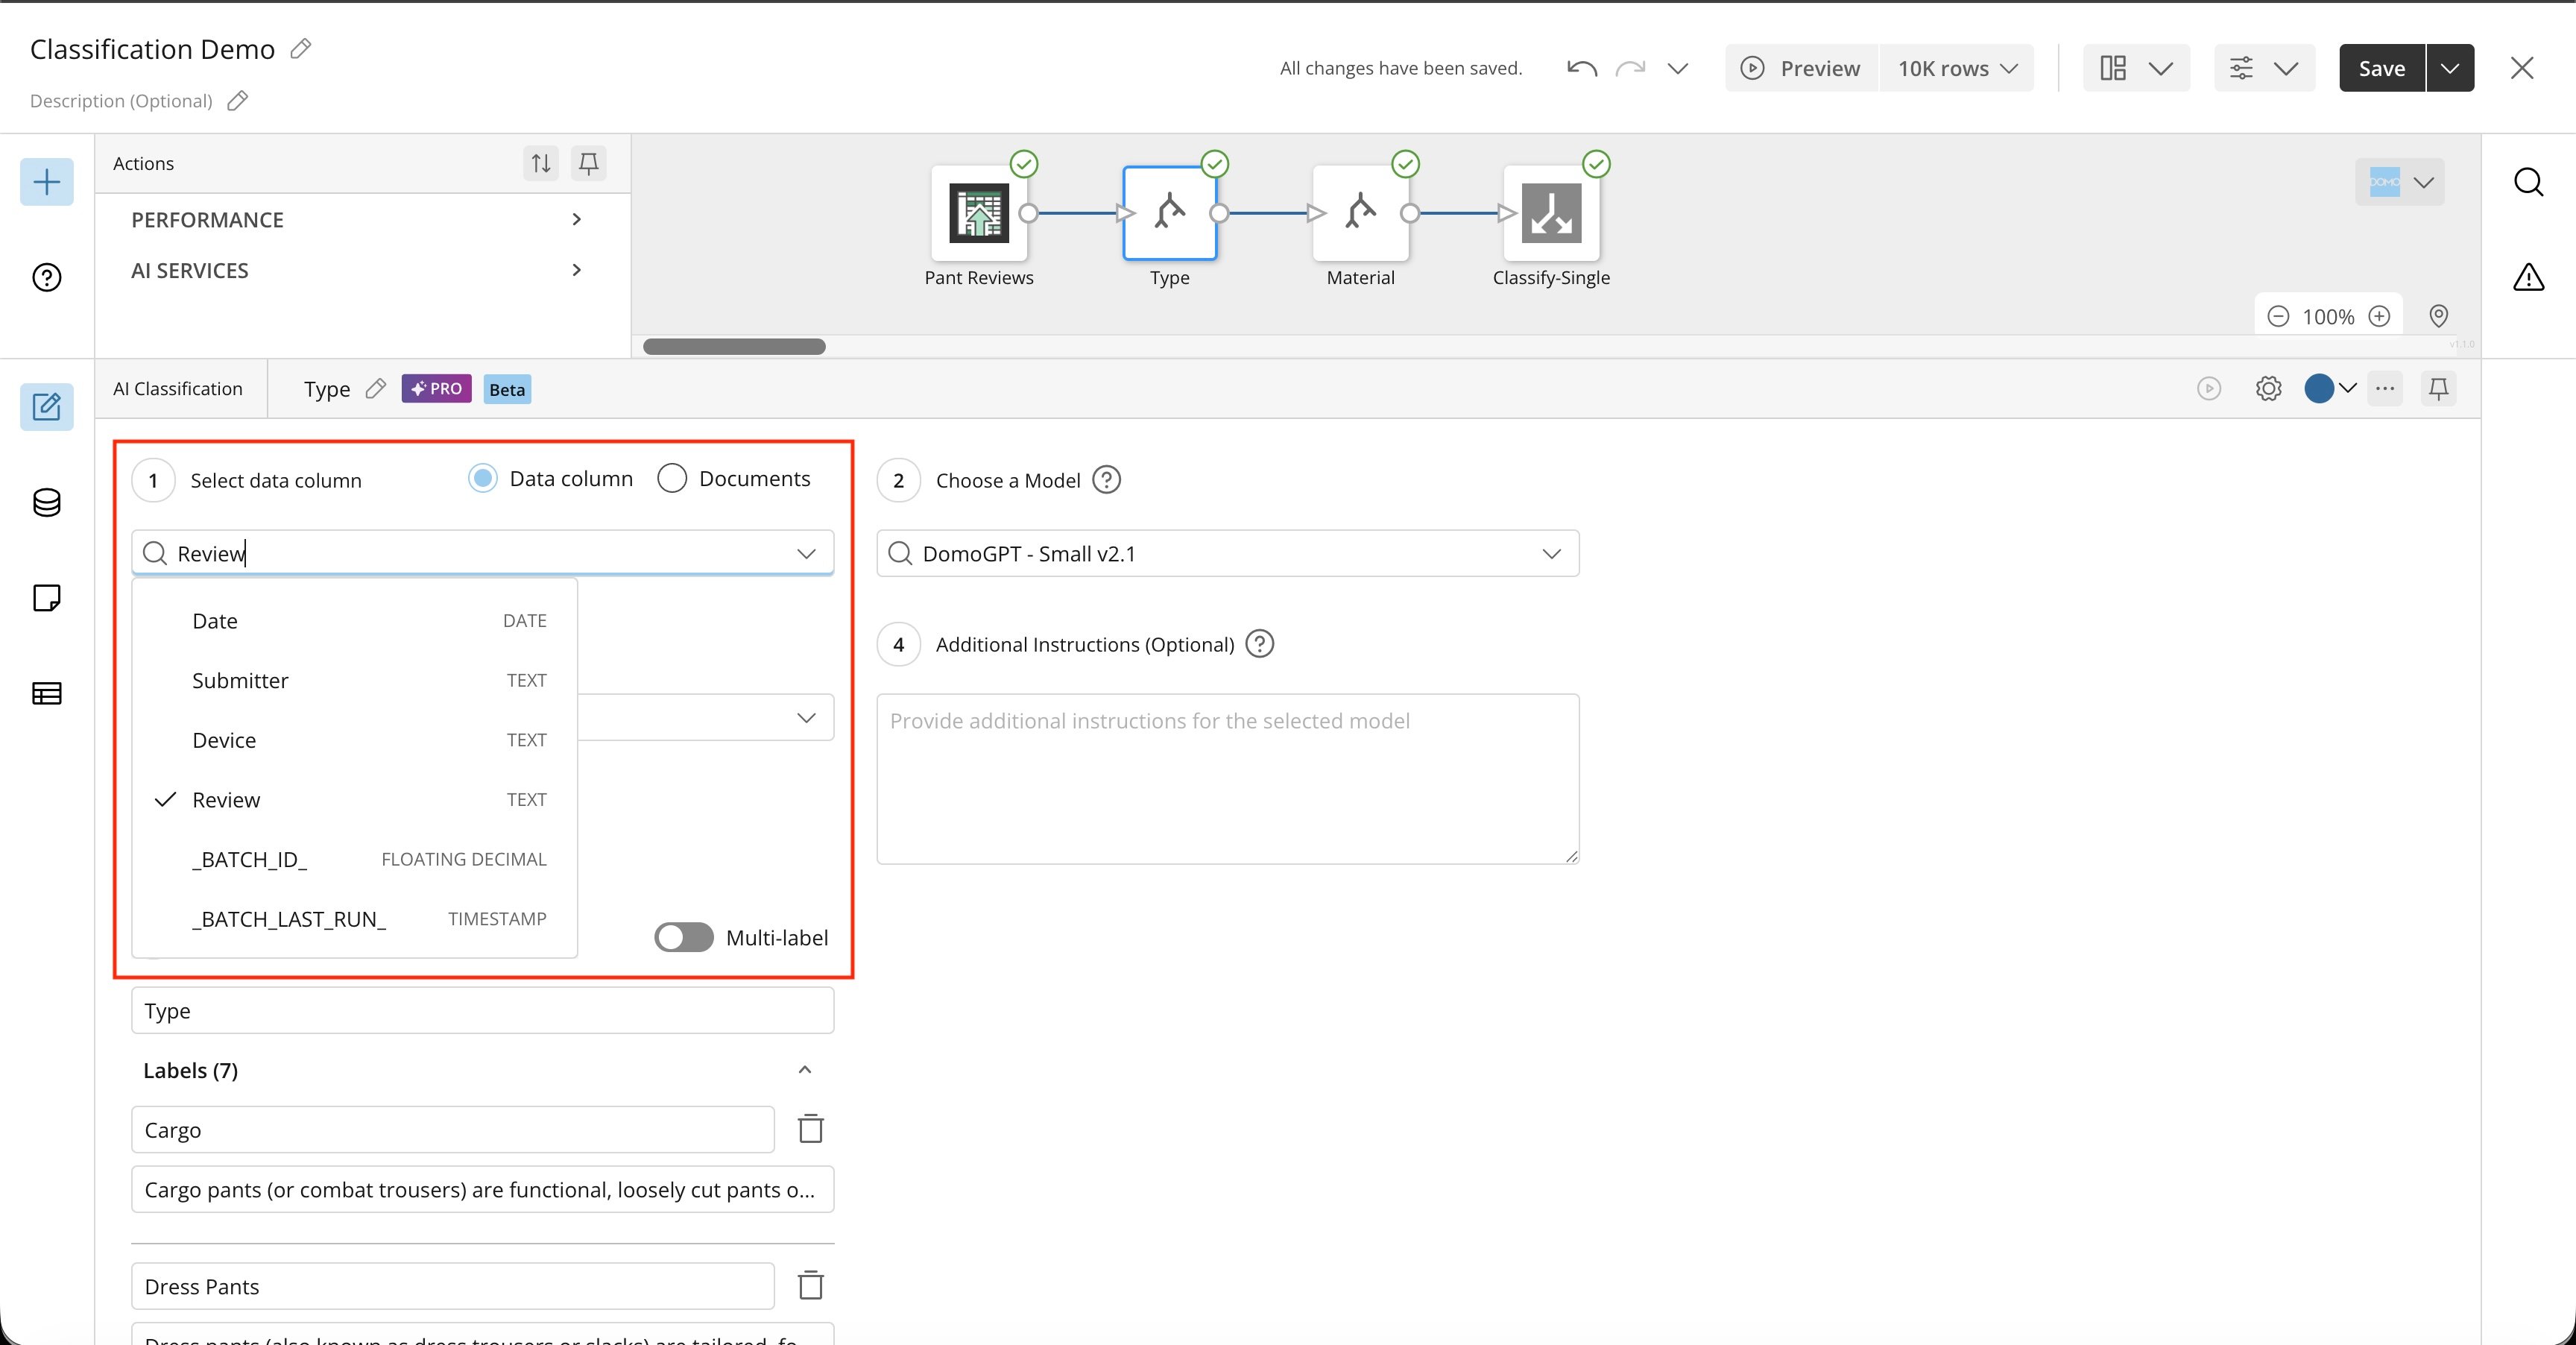 If the data you want to classify is in a Document Collection, select the Document Collection ID and File Path from the selectors.
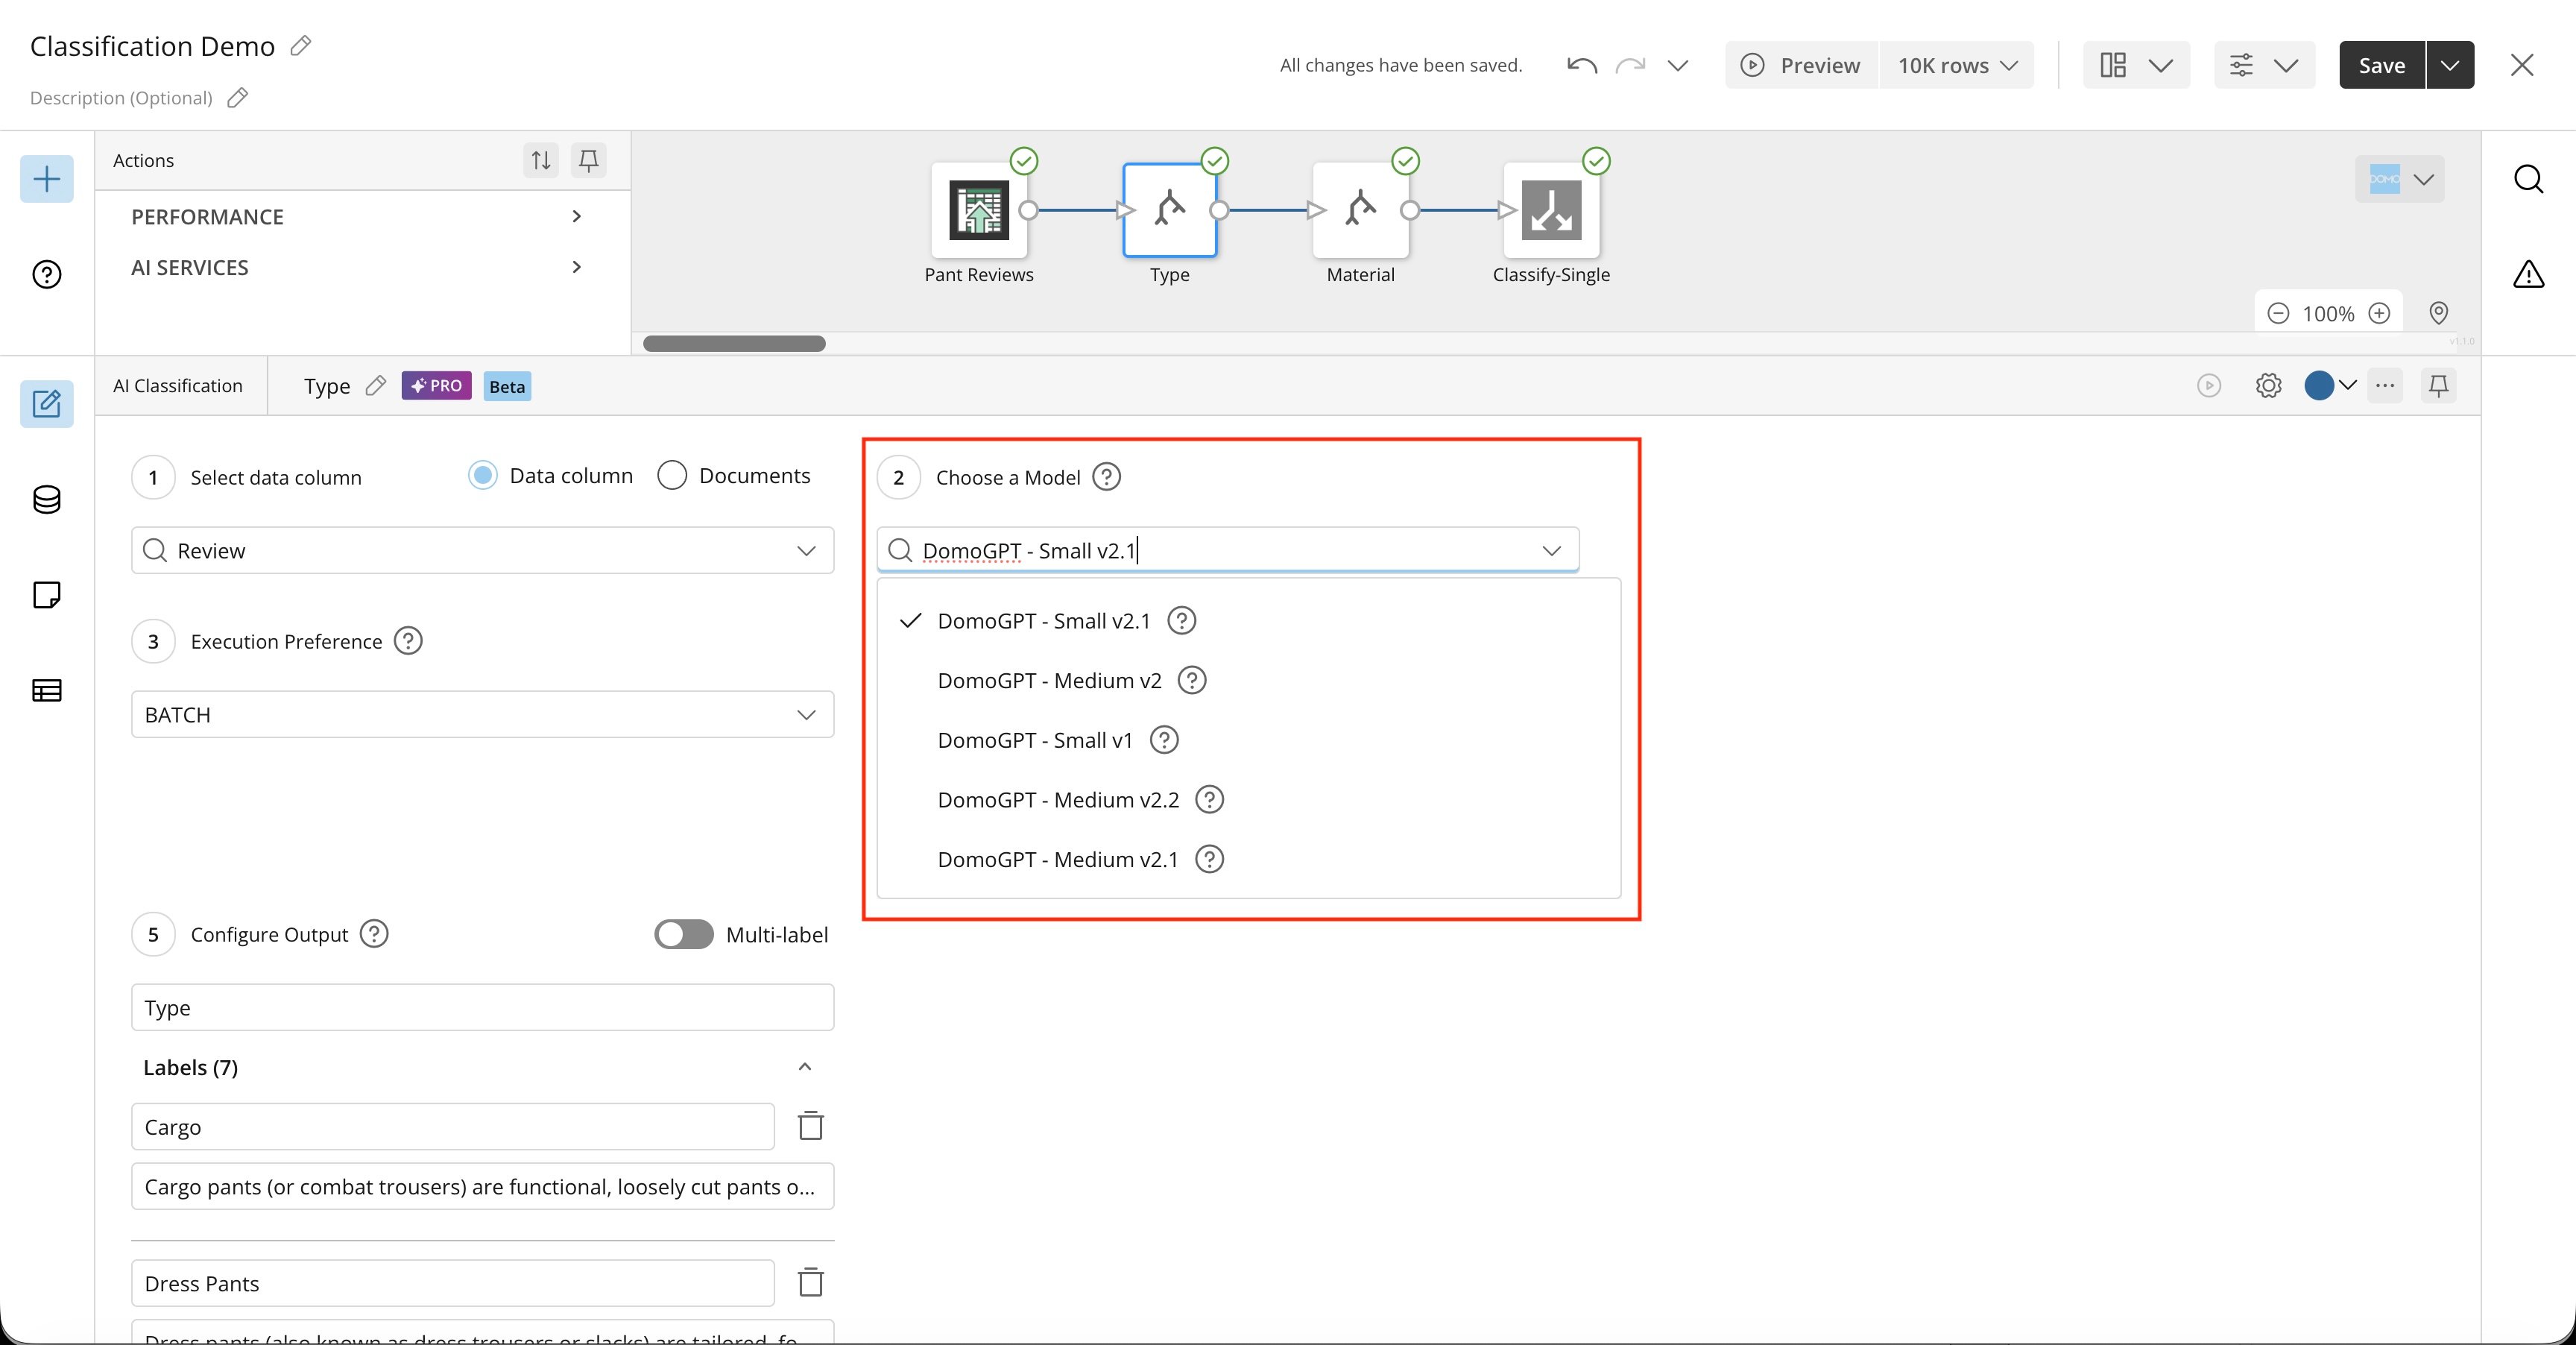
 4. In the tile editor, choose the AI model you want to use with the
Classification tile.
4. In the tile editor, choose the AI model you want to use with the
Classification tile.
 5\. Choose the Execution Preference.
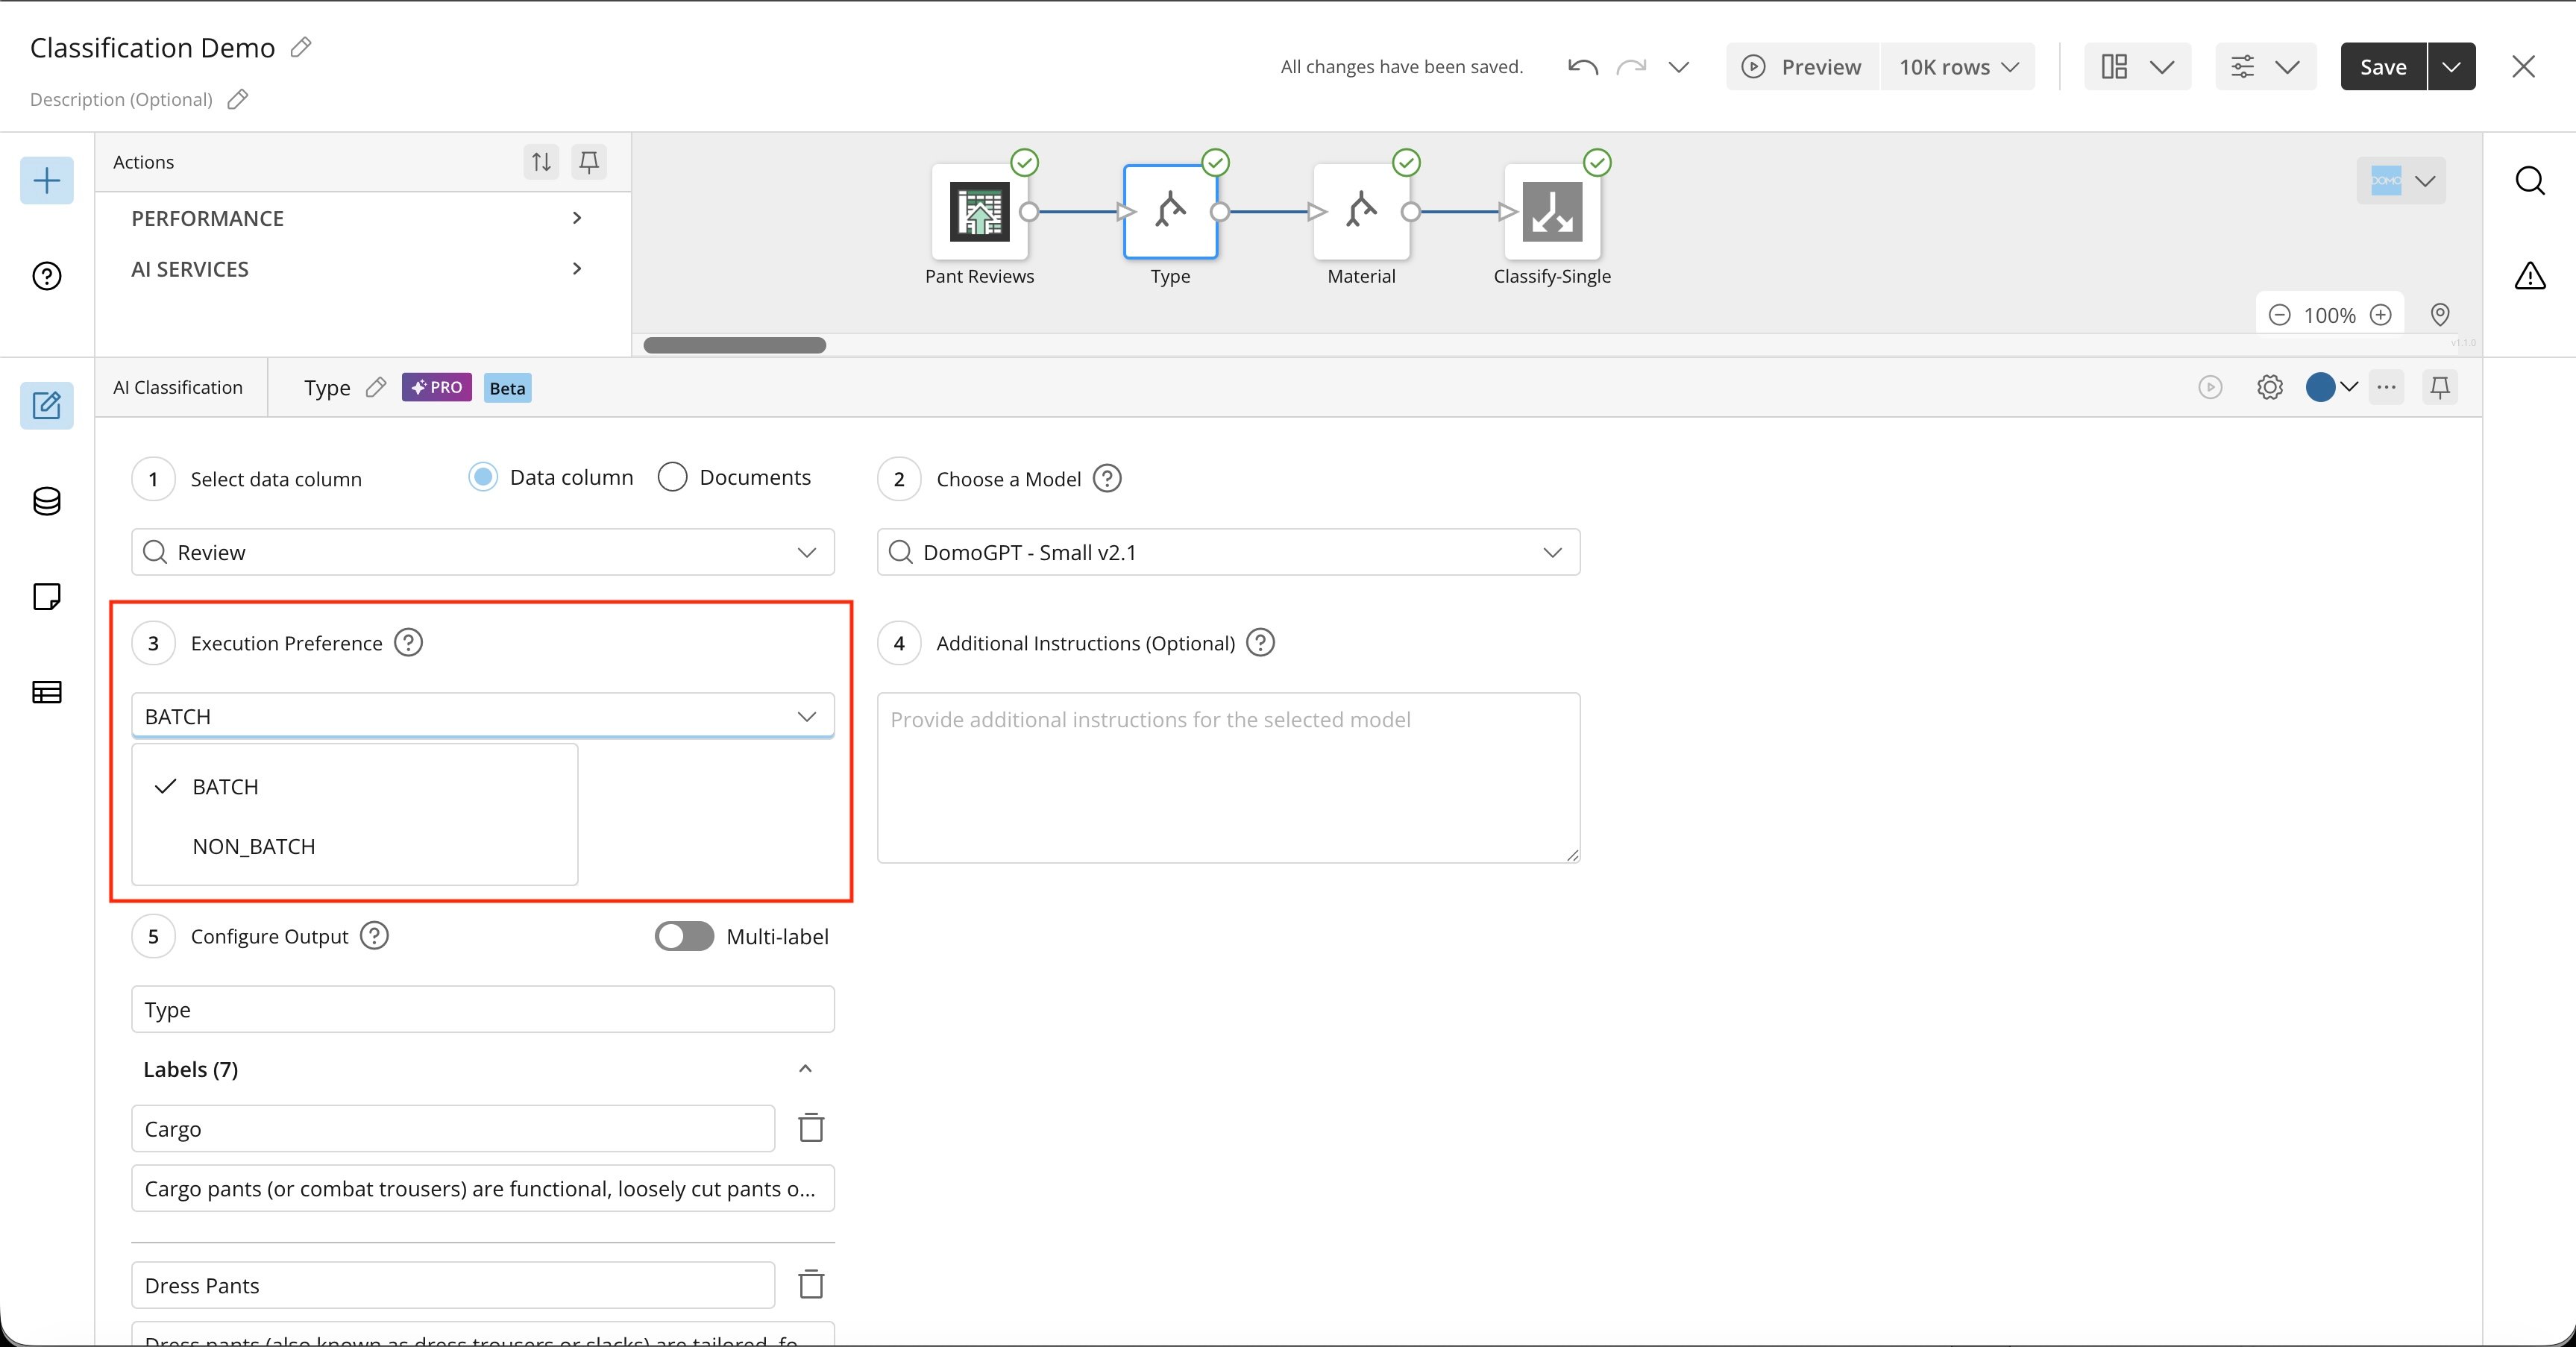 **Note:** Batch and non-batch processing differ primarily in latency, cost, and use case.
Batch processing is designed for high-volume, asynchronous workloads, so execution times vary. It's generally more cost-effective.
Non-batch processing is intended for more consistent execution times with a small number of rows. Non-batch is always used when processing fewer than 100 rows of data.
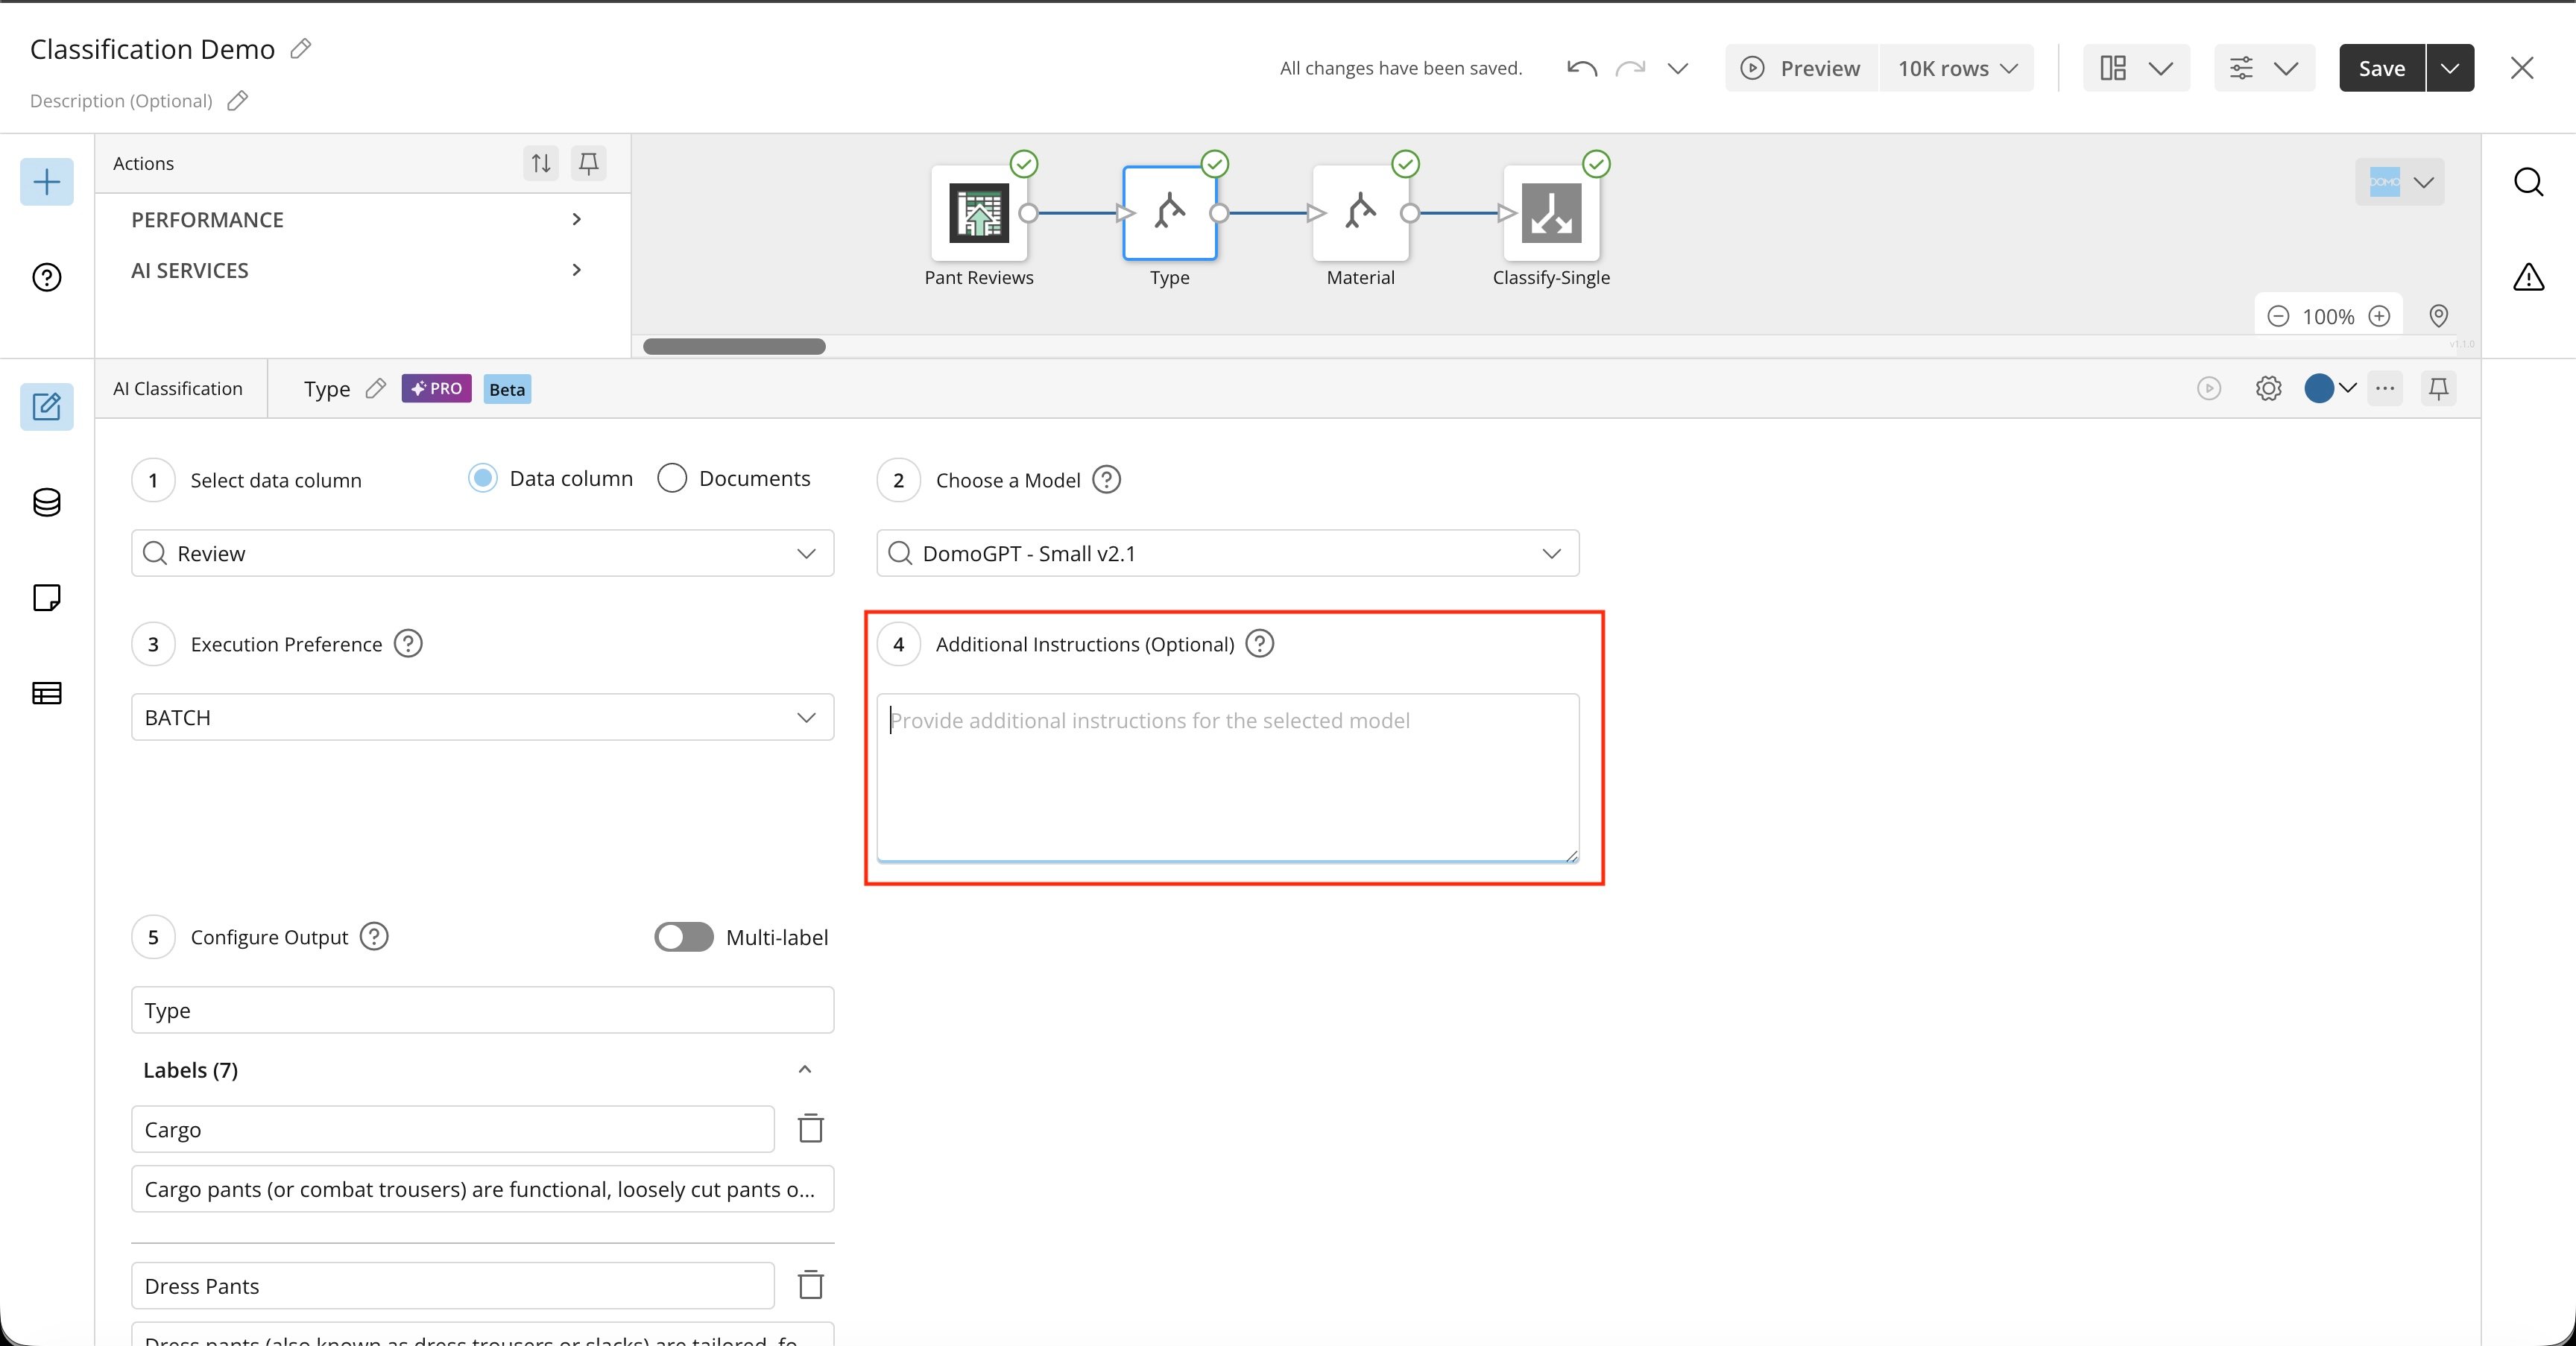
6. Provide the model with any additional instructions on how to analyze the column. Be very
specific; describe exactly what you want the model to do (and not to do).
**Tip:** Constructing a prompt that returns the results you need is a skill
that takes time and practice.
**Note:** Batch and non-batch processing differ primarily in latency, cost, and use case.
Batch processing is designed for high-volume, asynchronous workloads, so execution times vary. It's generally more cost-effective.
Non-batch processing is intended for more consistent execution times with a small number of rows. Non-batch is always used when processing fewer than 100 rows of data.
6. Provide the model with any additional instructions on how to analyze the column. Be very
specific; describe exactly what you want the model to do (and not to do).
**Tip:** Constructing a prompt that returns the results you need is a skill
that takes time and practice.
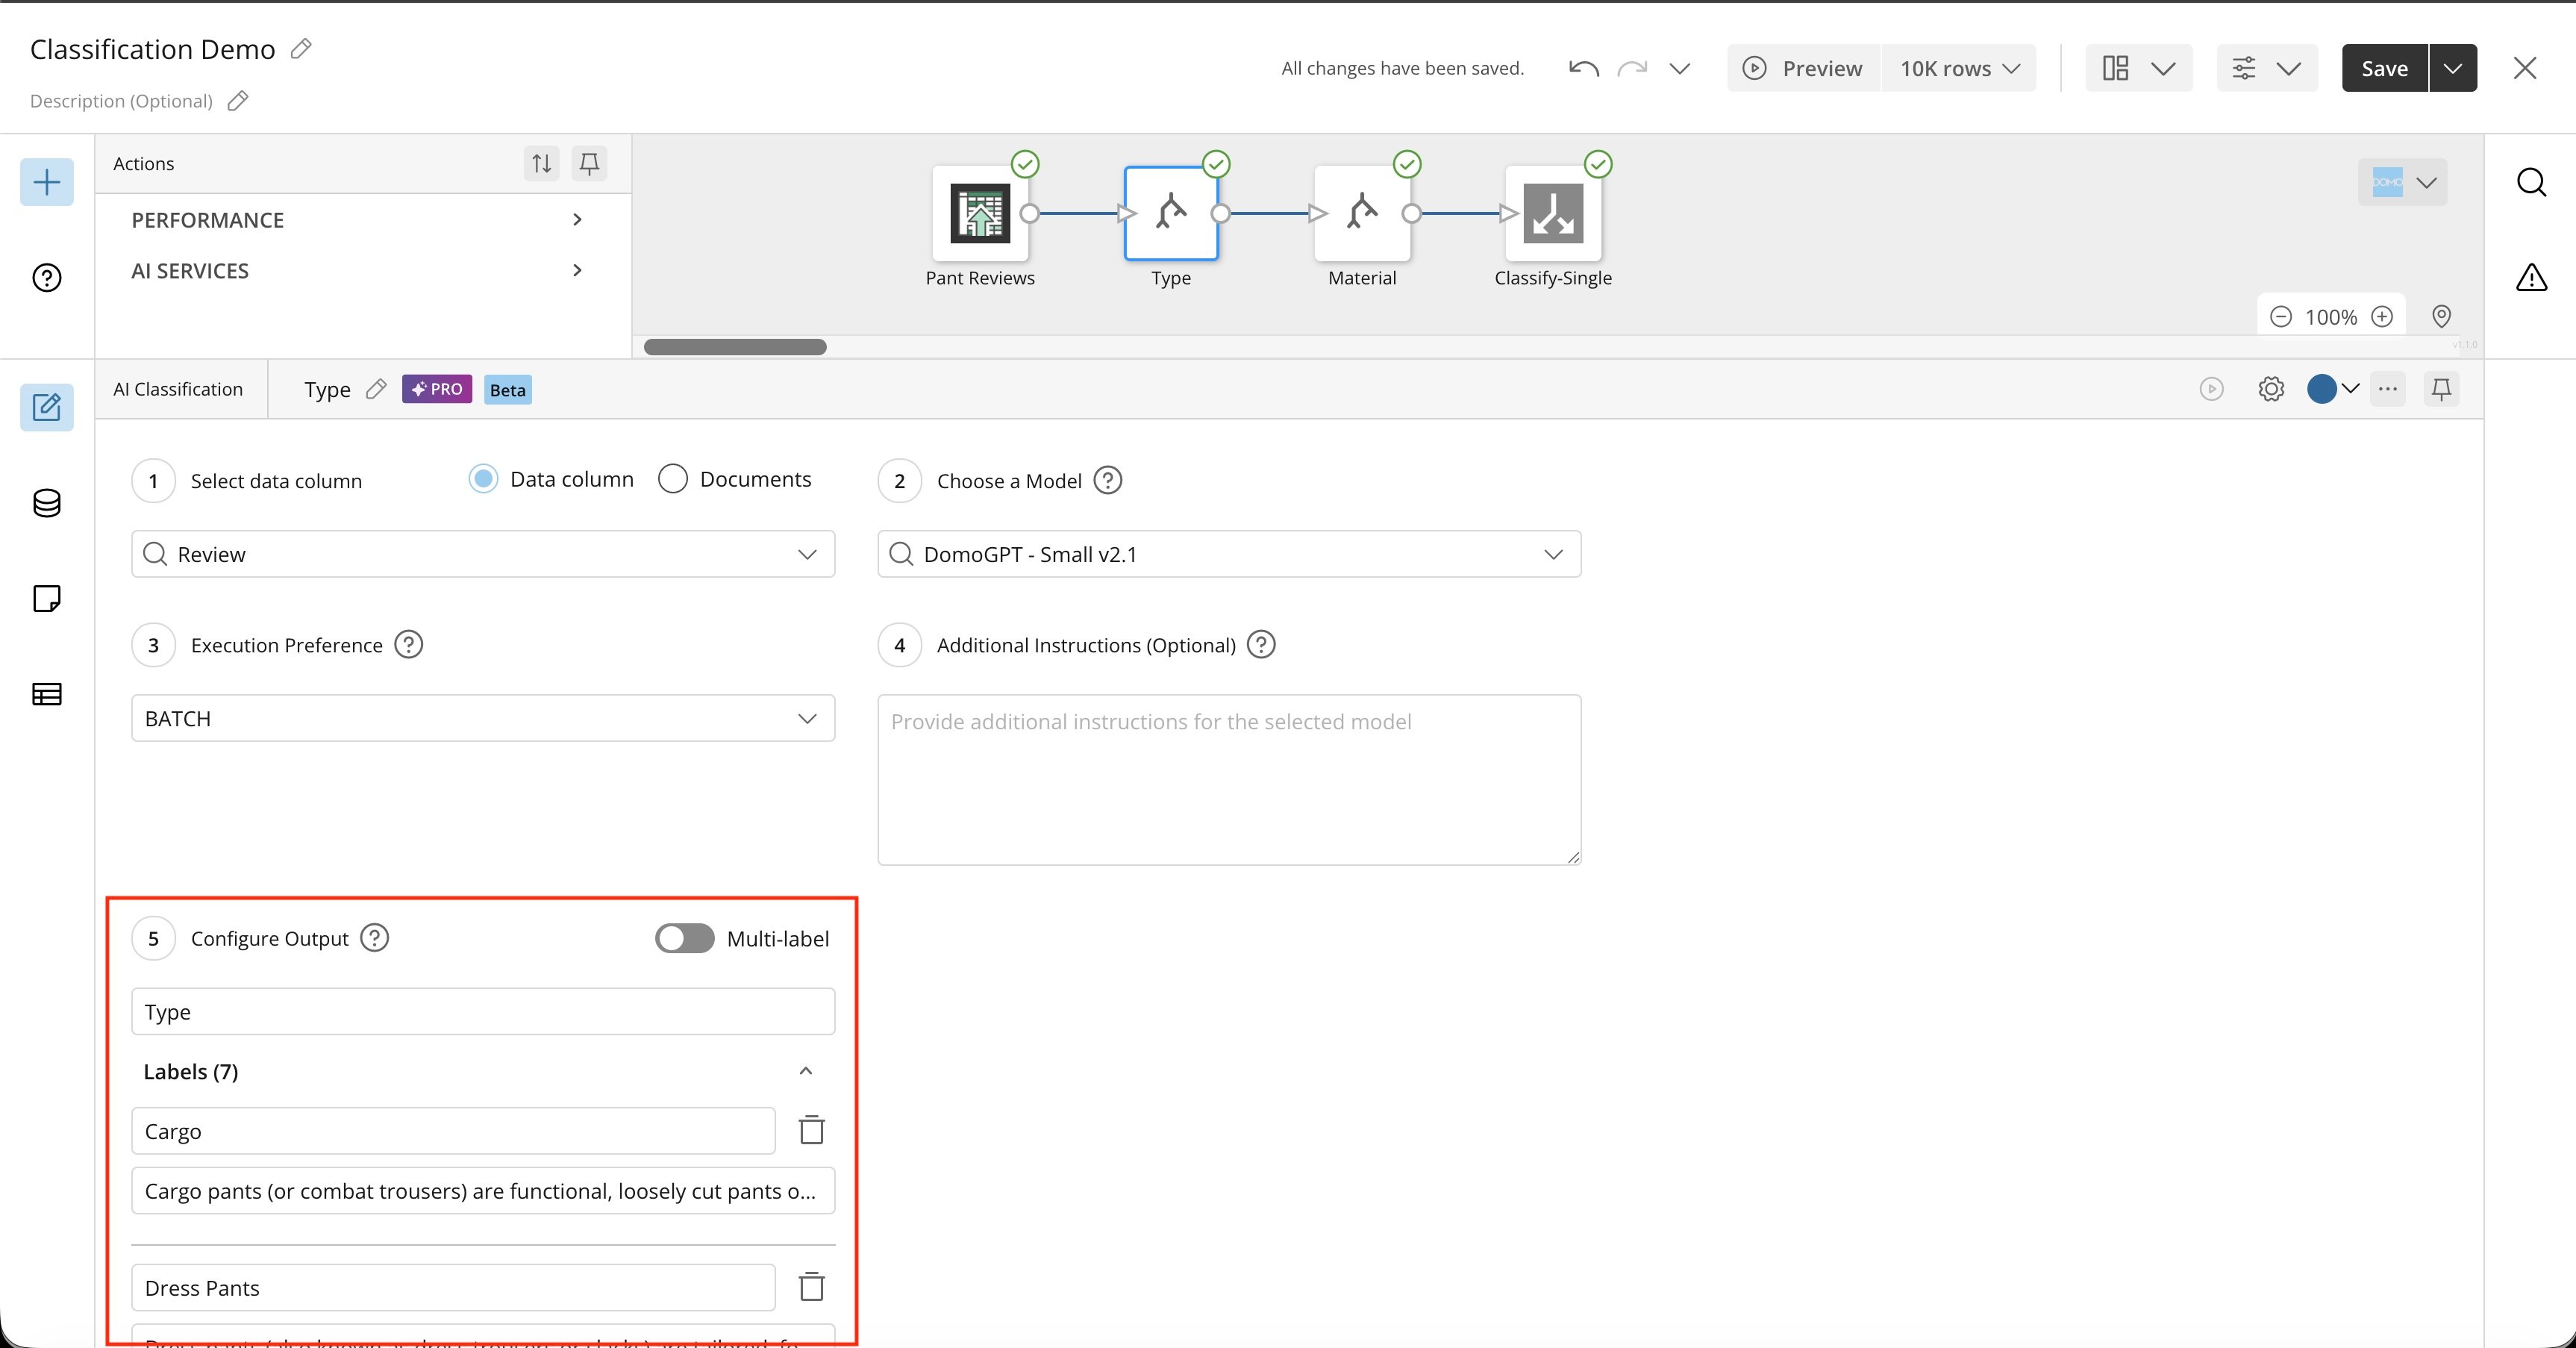
 7\. Configure the desired output—**Single Label** or **Multi Label**.
* **Single Label** assigns one class per row. For example, given the classes Corduroy, Denim, and Leather, a row's `Fabric Type` resolves to a single value:
```
Fabric Type = Denim
```
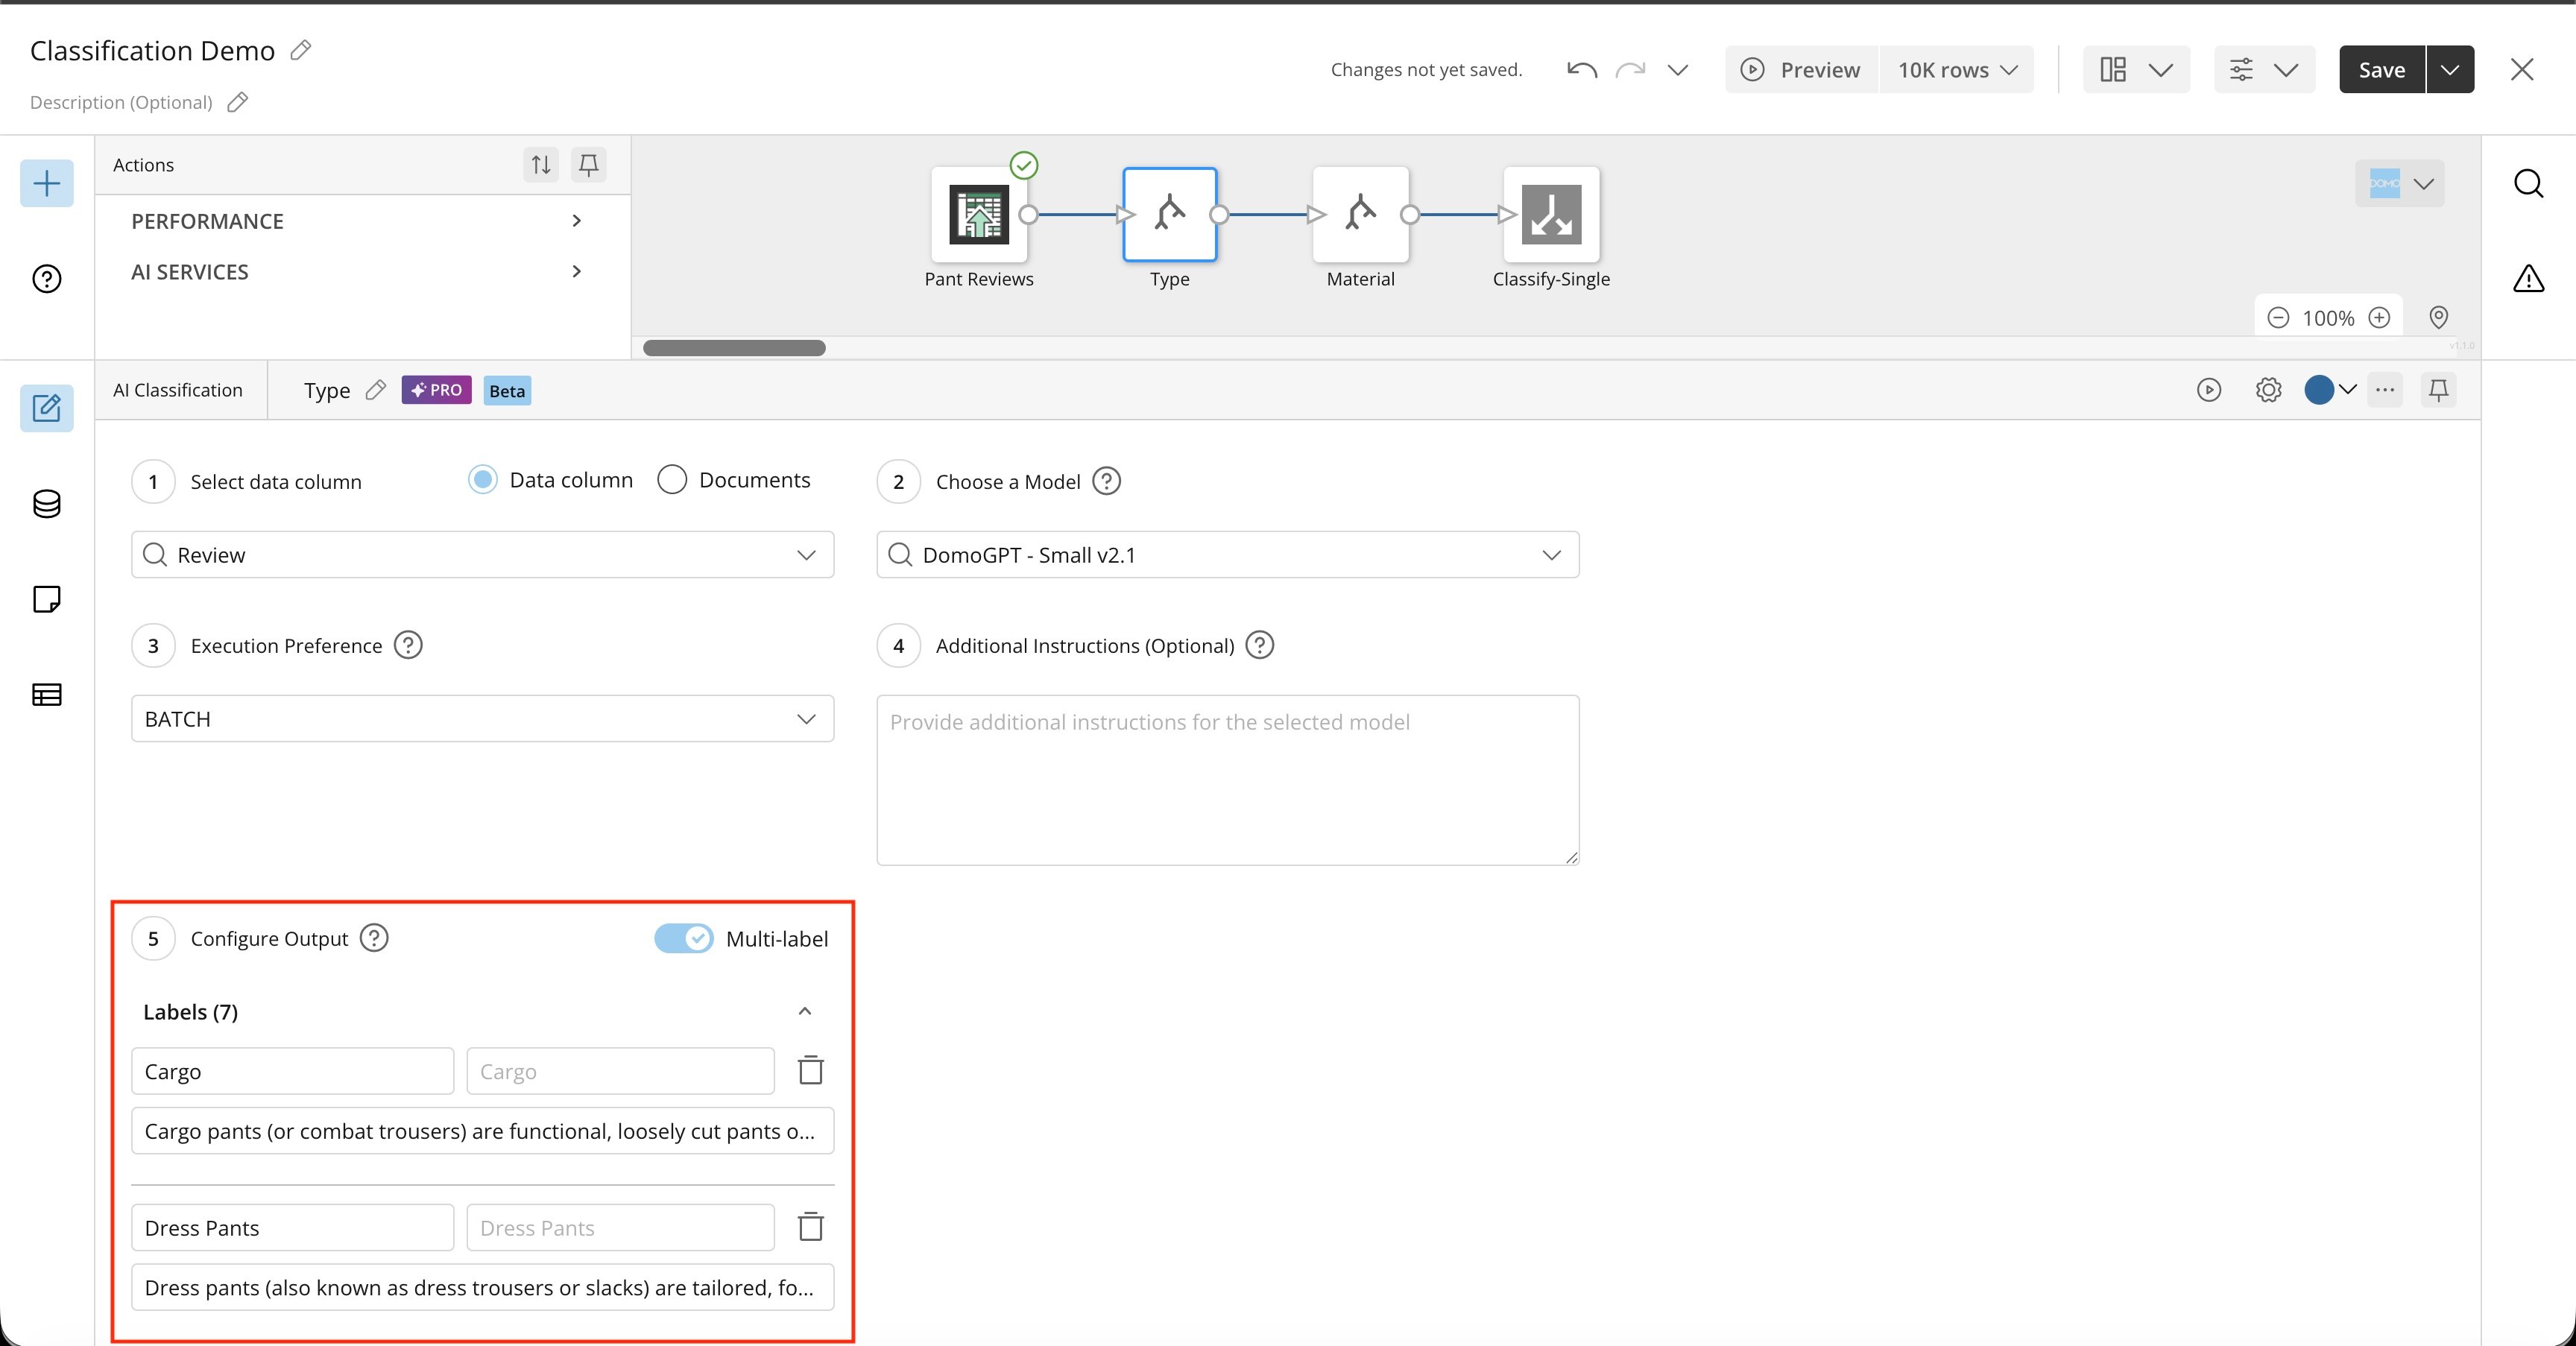
* **Multi Label** evaluates each class independently and returns one-hot-encoded Boolean values. For example, given the classes Corduroy, Denim, Leather, Skinny, and Flare:
```
Corduroy = True
Denim = False
Leather = False
Skinny = False
Flare = True
```
7\. Configure the desired output—**Single Label** or **Multi Label**.
* **Single Label** assigns one class per row. For example, given the classes Corduroy, Denim, and Leather, a row's `Fabric Type` resolves to a single value:
```
Fabric Type = Denim
```
* **Multi Label** evaluates each class independently and returns one-hot-encoded Boolean values. For example, given the classes Corduroy, Denim, Leather, Skinny, and Flare:
```
Corduroy = True
Denim = False
Leather = False
Skinny = False
Flare = True
```
 After the Classification tile executes, it adds a classification column or columns to your DataSet. You can use tiles farther downstream in the DataFlow to rename that column(s).
**Consumption Ramifications:**
* AI Operations: 1 operation per tile
* Tokens: input and output tokens vary based on the prompt and the data volume processed
**Notes:**
* You can include multiple Classification tiles in the same DataFlow, tasking them with different aspects of analysis for the column (or analysis of different columns).
## FAQ
Not currently, but this capability is on the roadmap.
Yes, you can enable Multi Label output.
## Sentiment Analysis Tile Beta
After the Classification tile executes, it adds a classification column or columns to your DataSet. You can use tiles farther downstream in the DataFlow to rename that column(s).
**Consumption Ramifications:**
* AI Operations: 1 operation per tile
* Tokens: input and output tokens vary based on the prompt and the data volume processed
**Notes:**
* You can include multiple Classification tiles in the same DataFlow, tasking them with different aspects of analysis for the column (or analysis of different columns).
## FAQ
Not currently, but this capability is on the roadmap.
Yes, you can enable Multi Label output.
## Sentiment Analysis Tile Beta
 The Sentiment Analysis tile automatically classifies text—such as reviews, social media posts, and surveys—as positive, negative, or neutral. This helps businesses monitor brand reputation in real time, improve customer service by identifying frustrated users, and analyze trends for better decision-making.
**Supported values:** Positive, Negative, Neutral, Not Applicable
Because the tile comes pre-configured for sentiment analysis, you can focus on your topics instead of configuration details. It's faster and easier to configure and use than the Text Generation tile for sentiment analysis.
### Required Grants
To access the Sentiment Analysis tile in Magic ETL, the following grants must be enabled for your role:
* Execute AutoML
* Create AI Service Models
* Use AI Services
Learn more about [grants](/s/article/360043438973).
**Important:** You must also have AI Services enabled and the ability to
create a DataFlow. Learn how to [create a DataFlow](/s/article/360055259234).
### Configure the Sentiment Analysis Tile
1. Open the Magic ETL canvas and choose an input DataSet that contains a text column you want to analyze.
**Important:** Due to an AWS limitation, if the DataSet you choose has fewer than 100 rows, the
system automatically switches to non-batch mode.
The Sentiment Analysis tile automatically classifies text—such as reviews, social media posts, and surveys—as positive, negative, or neutral. This helps businesses monitor brand reputation in real time, improve customer service by identifying frustrated users, and analyze trends for better decision-making.
**Supported values:** Positive, Negative, Neutral, Not Applicable
Because the tile comes pre-configured for sentiment analysis, you can focus on your topics instead of configuration details. It's faster and easier to configure and use than the Text Generation tile for sentiment analysis.
### Required Grants
To access the Sentiment Analysis tile in Magic ETL, the following grants must be enabled for your role:
* Execute AutoML
* Create AI Service Models
* Use AI Services
Learn more about [grants](/s/article/360043438973).
**Important:** You must also have AI Services enabled and the ability to
create a DataFlow. Learn how to [create a DataFlow](/s/article/360055259234).
### Configure the Sentiment Analysis Tile
1. Open the Magic ETL canvas and choose an input DataSet that contains a text column you want to analyze.
**Important:** Due to an AWS limitation, if the DataSet you choose has fewer than 100 rows, the
system automatically switches to non-batch mode.
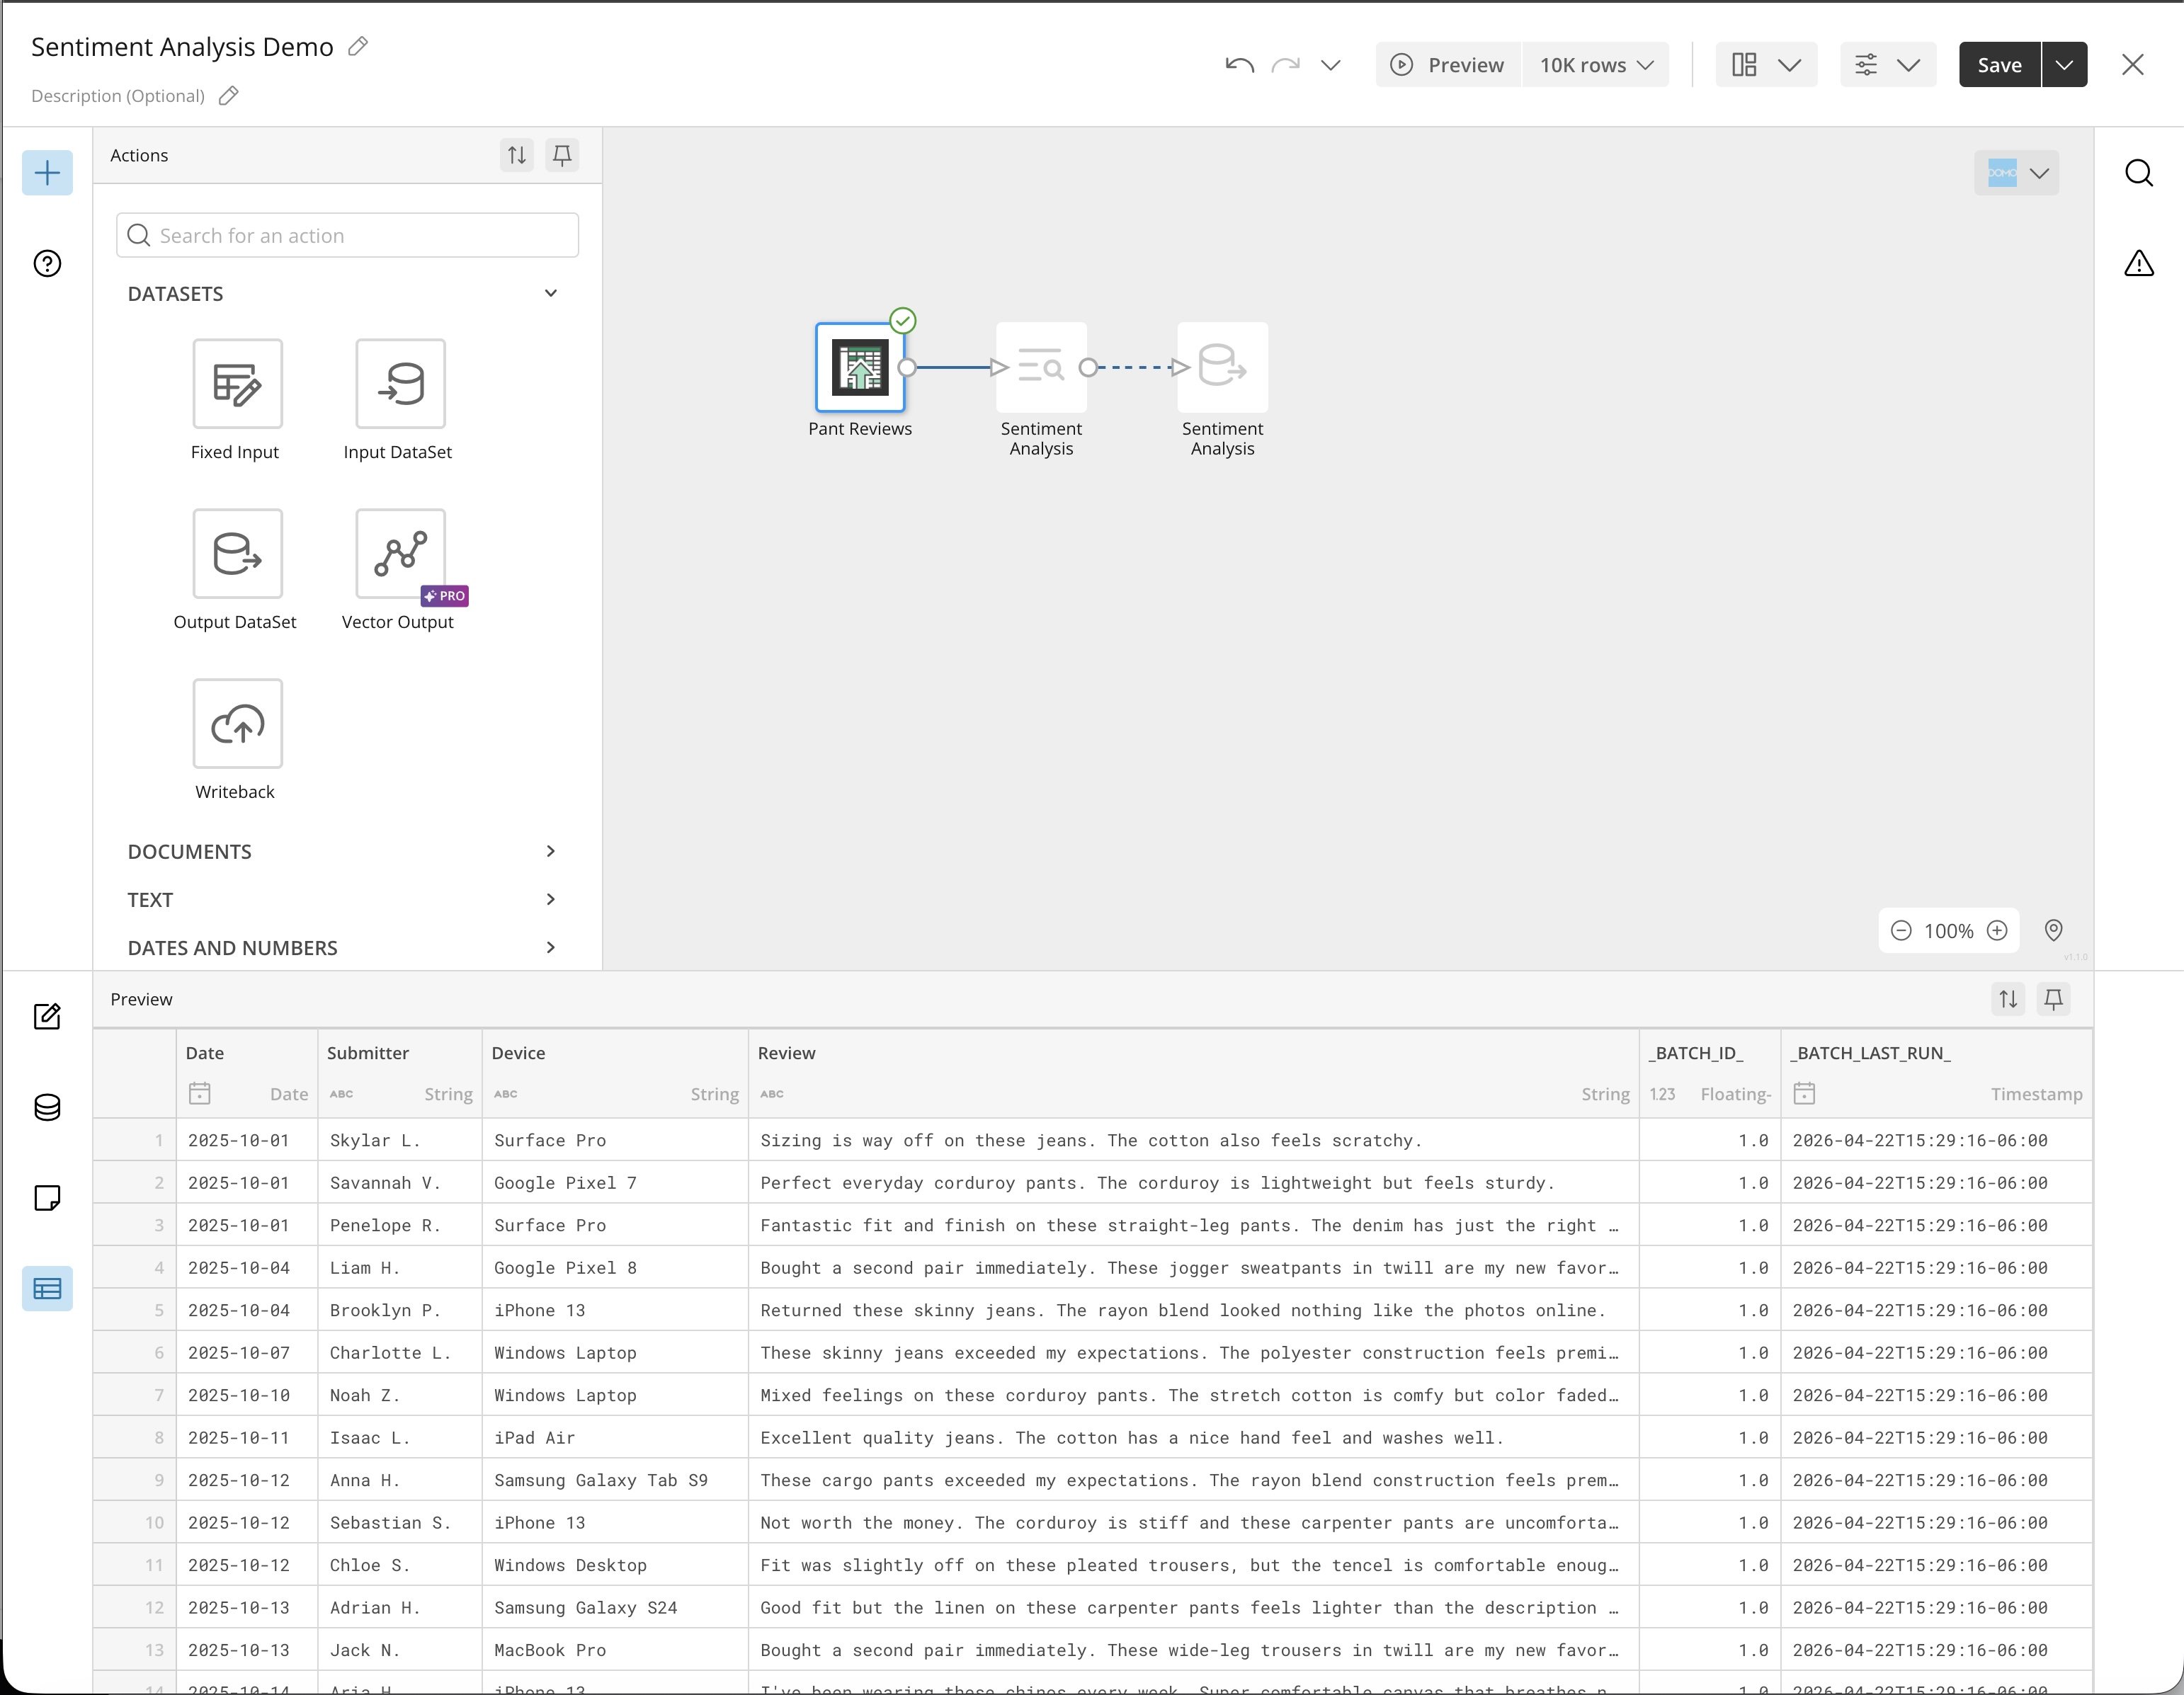 2\. Under **AI Services** in the left drawer, drag a Sentiment Analysis tile to the
canvas. The tile editor expands below the canvas.
2\. Under **AI Services** in the left drawer, drag a Sentiment Analysis tile to the
canvas. The tile editor expands below the canvas.
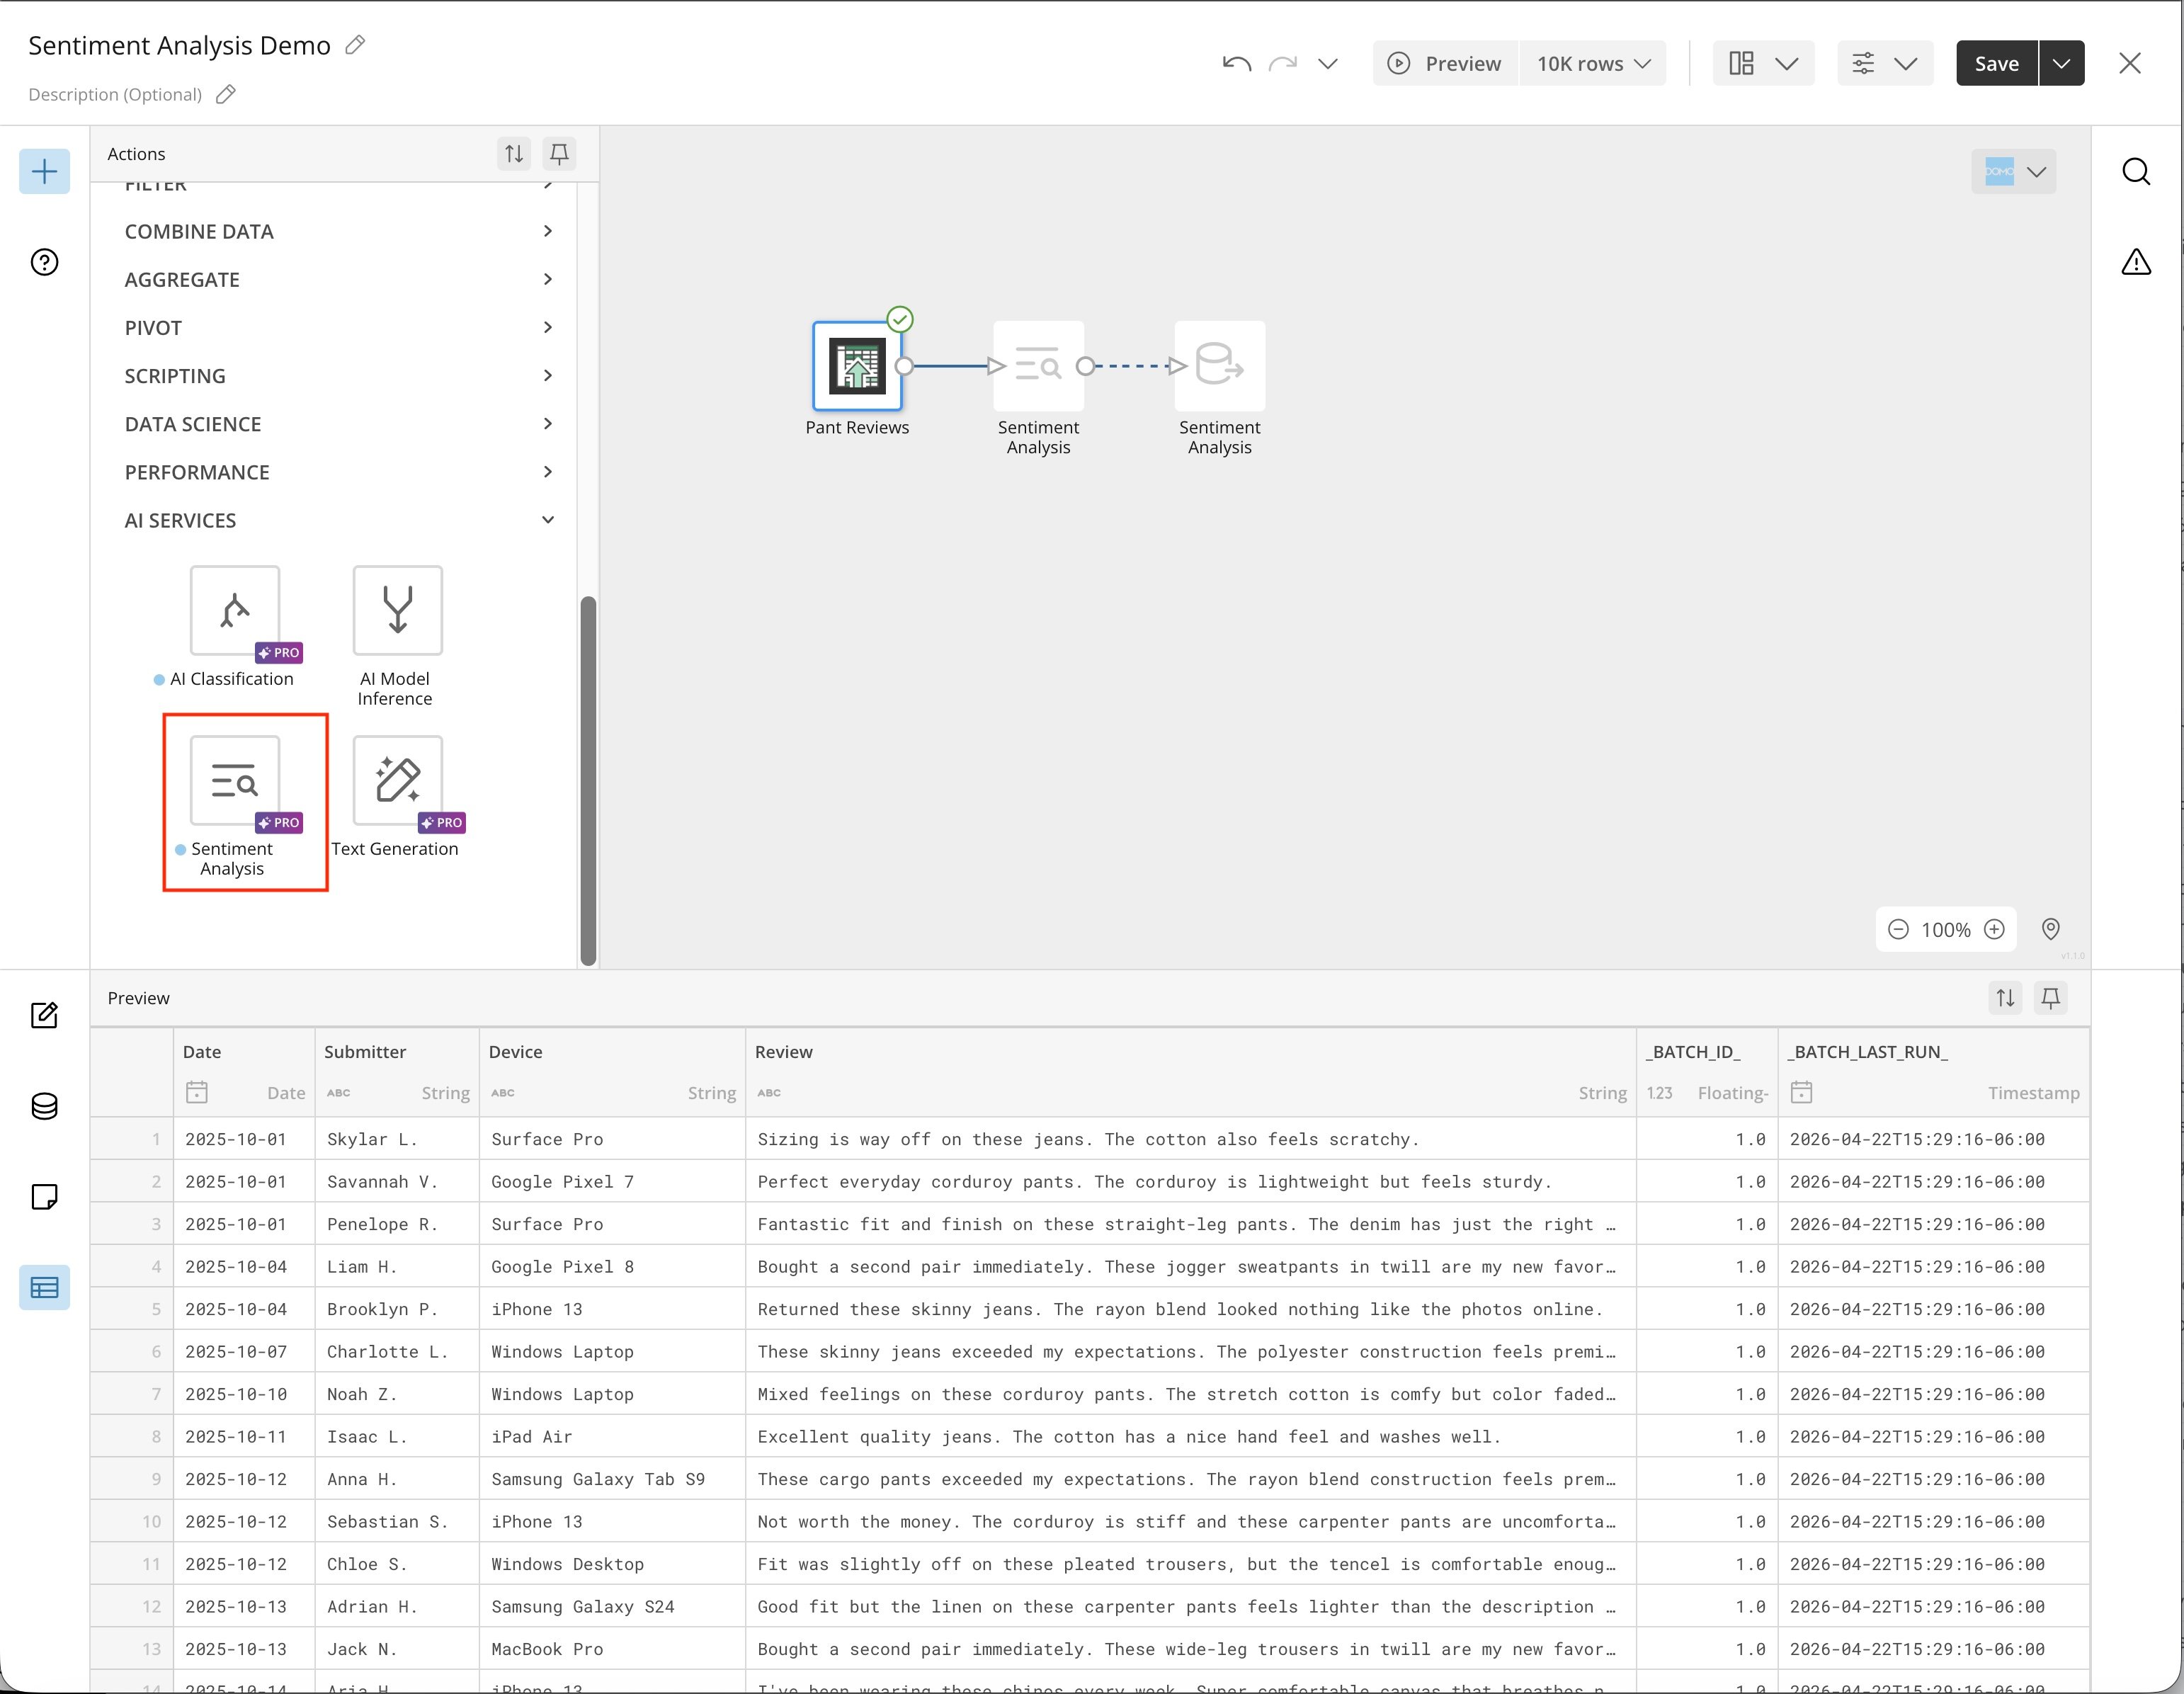 3\. In the tile editor, choose the input data; Data Column or Documents.
If the data you want to analyze is already in a data column, select the column from the selector.
If the data you want to classify is in a Document Collection, select the Document Collection ID and File Path from the selectors.
3\. In the tile editor, choose the input data; Data Column or Documents.
If the data you want to analyze is already in a data column, select the column from the selector.
If the data you want to classify is in a Document Collection, select the Document Collection ID and File Path from the selectors.
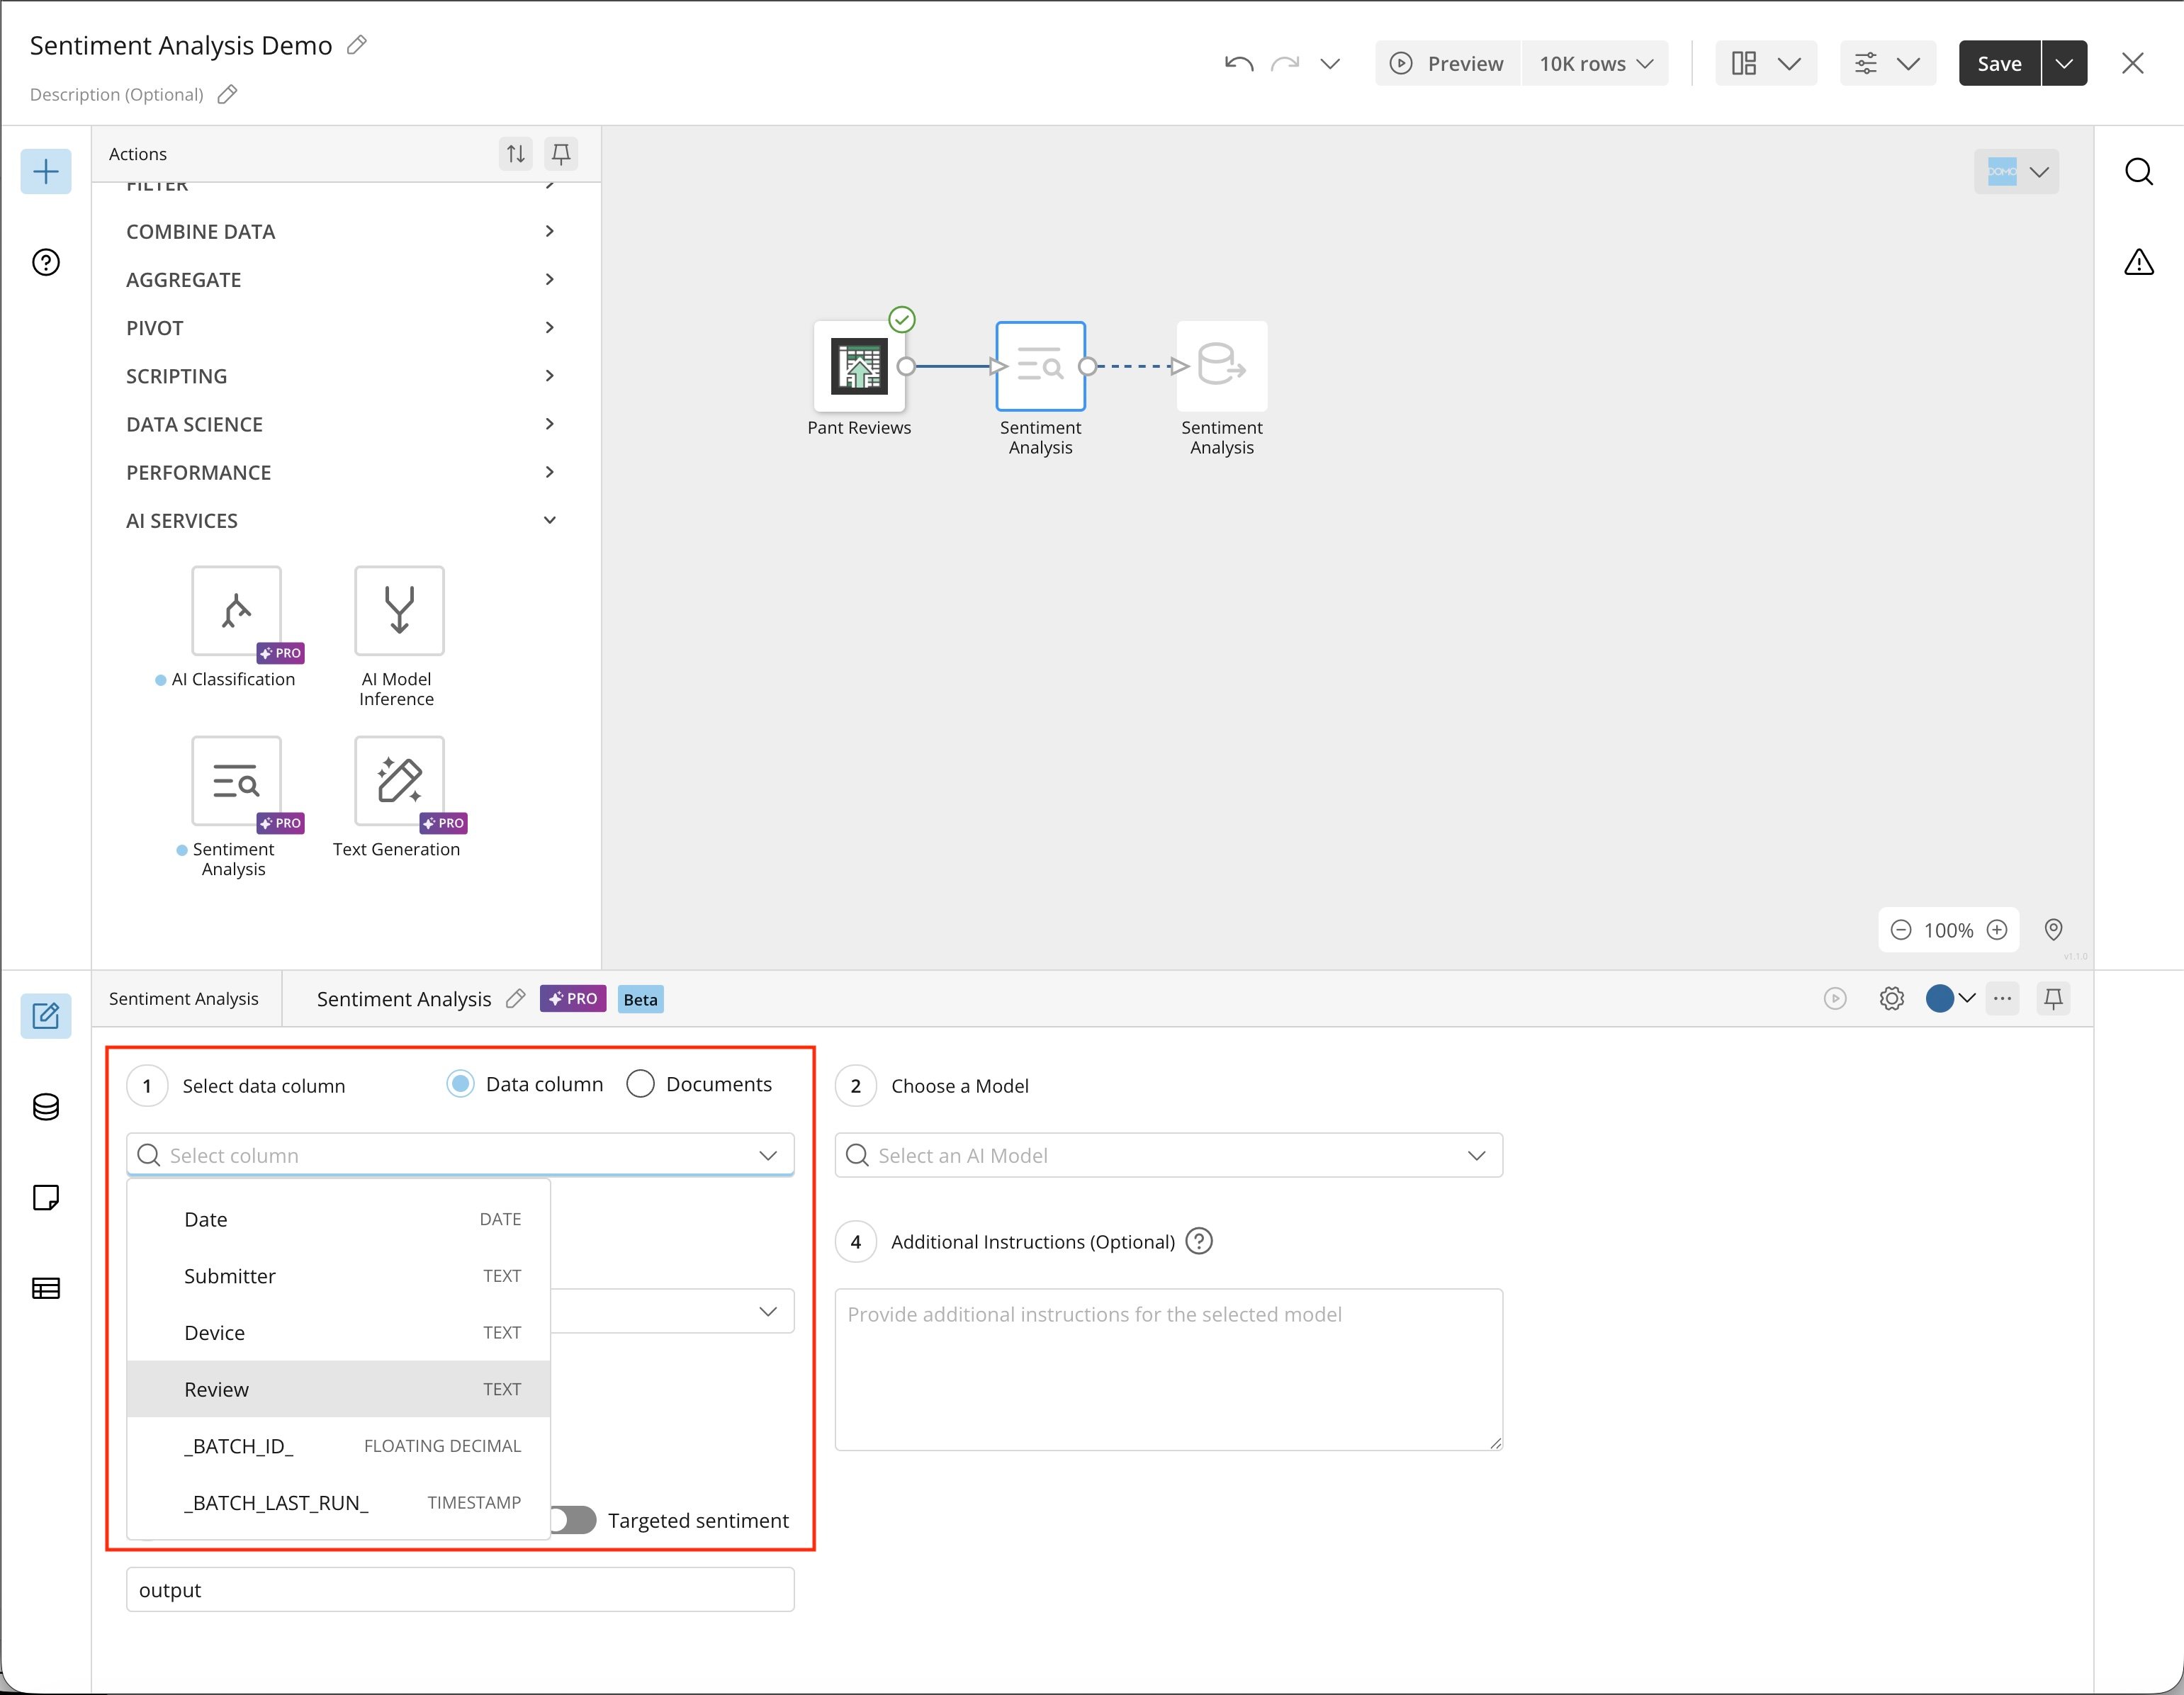 4\. In the tile editor, choose the AI model you want to use with the
Sentiment Analysis tile.
4\. In the tile editor, choose the AI model you want to use with the
Sentiment Analysis tile.
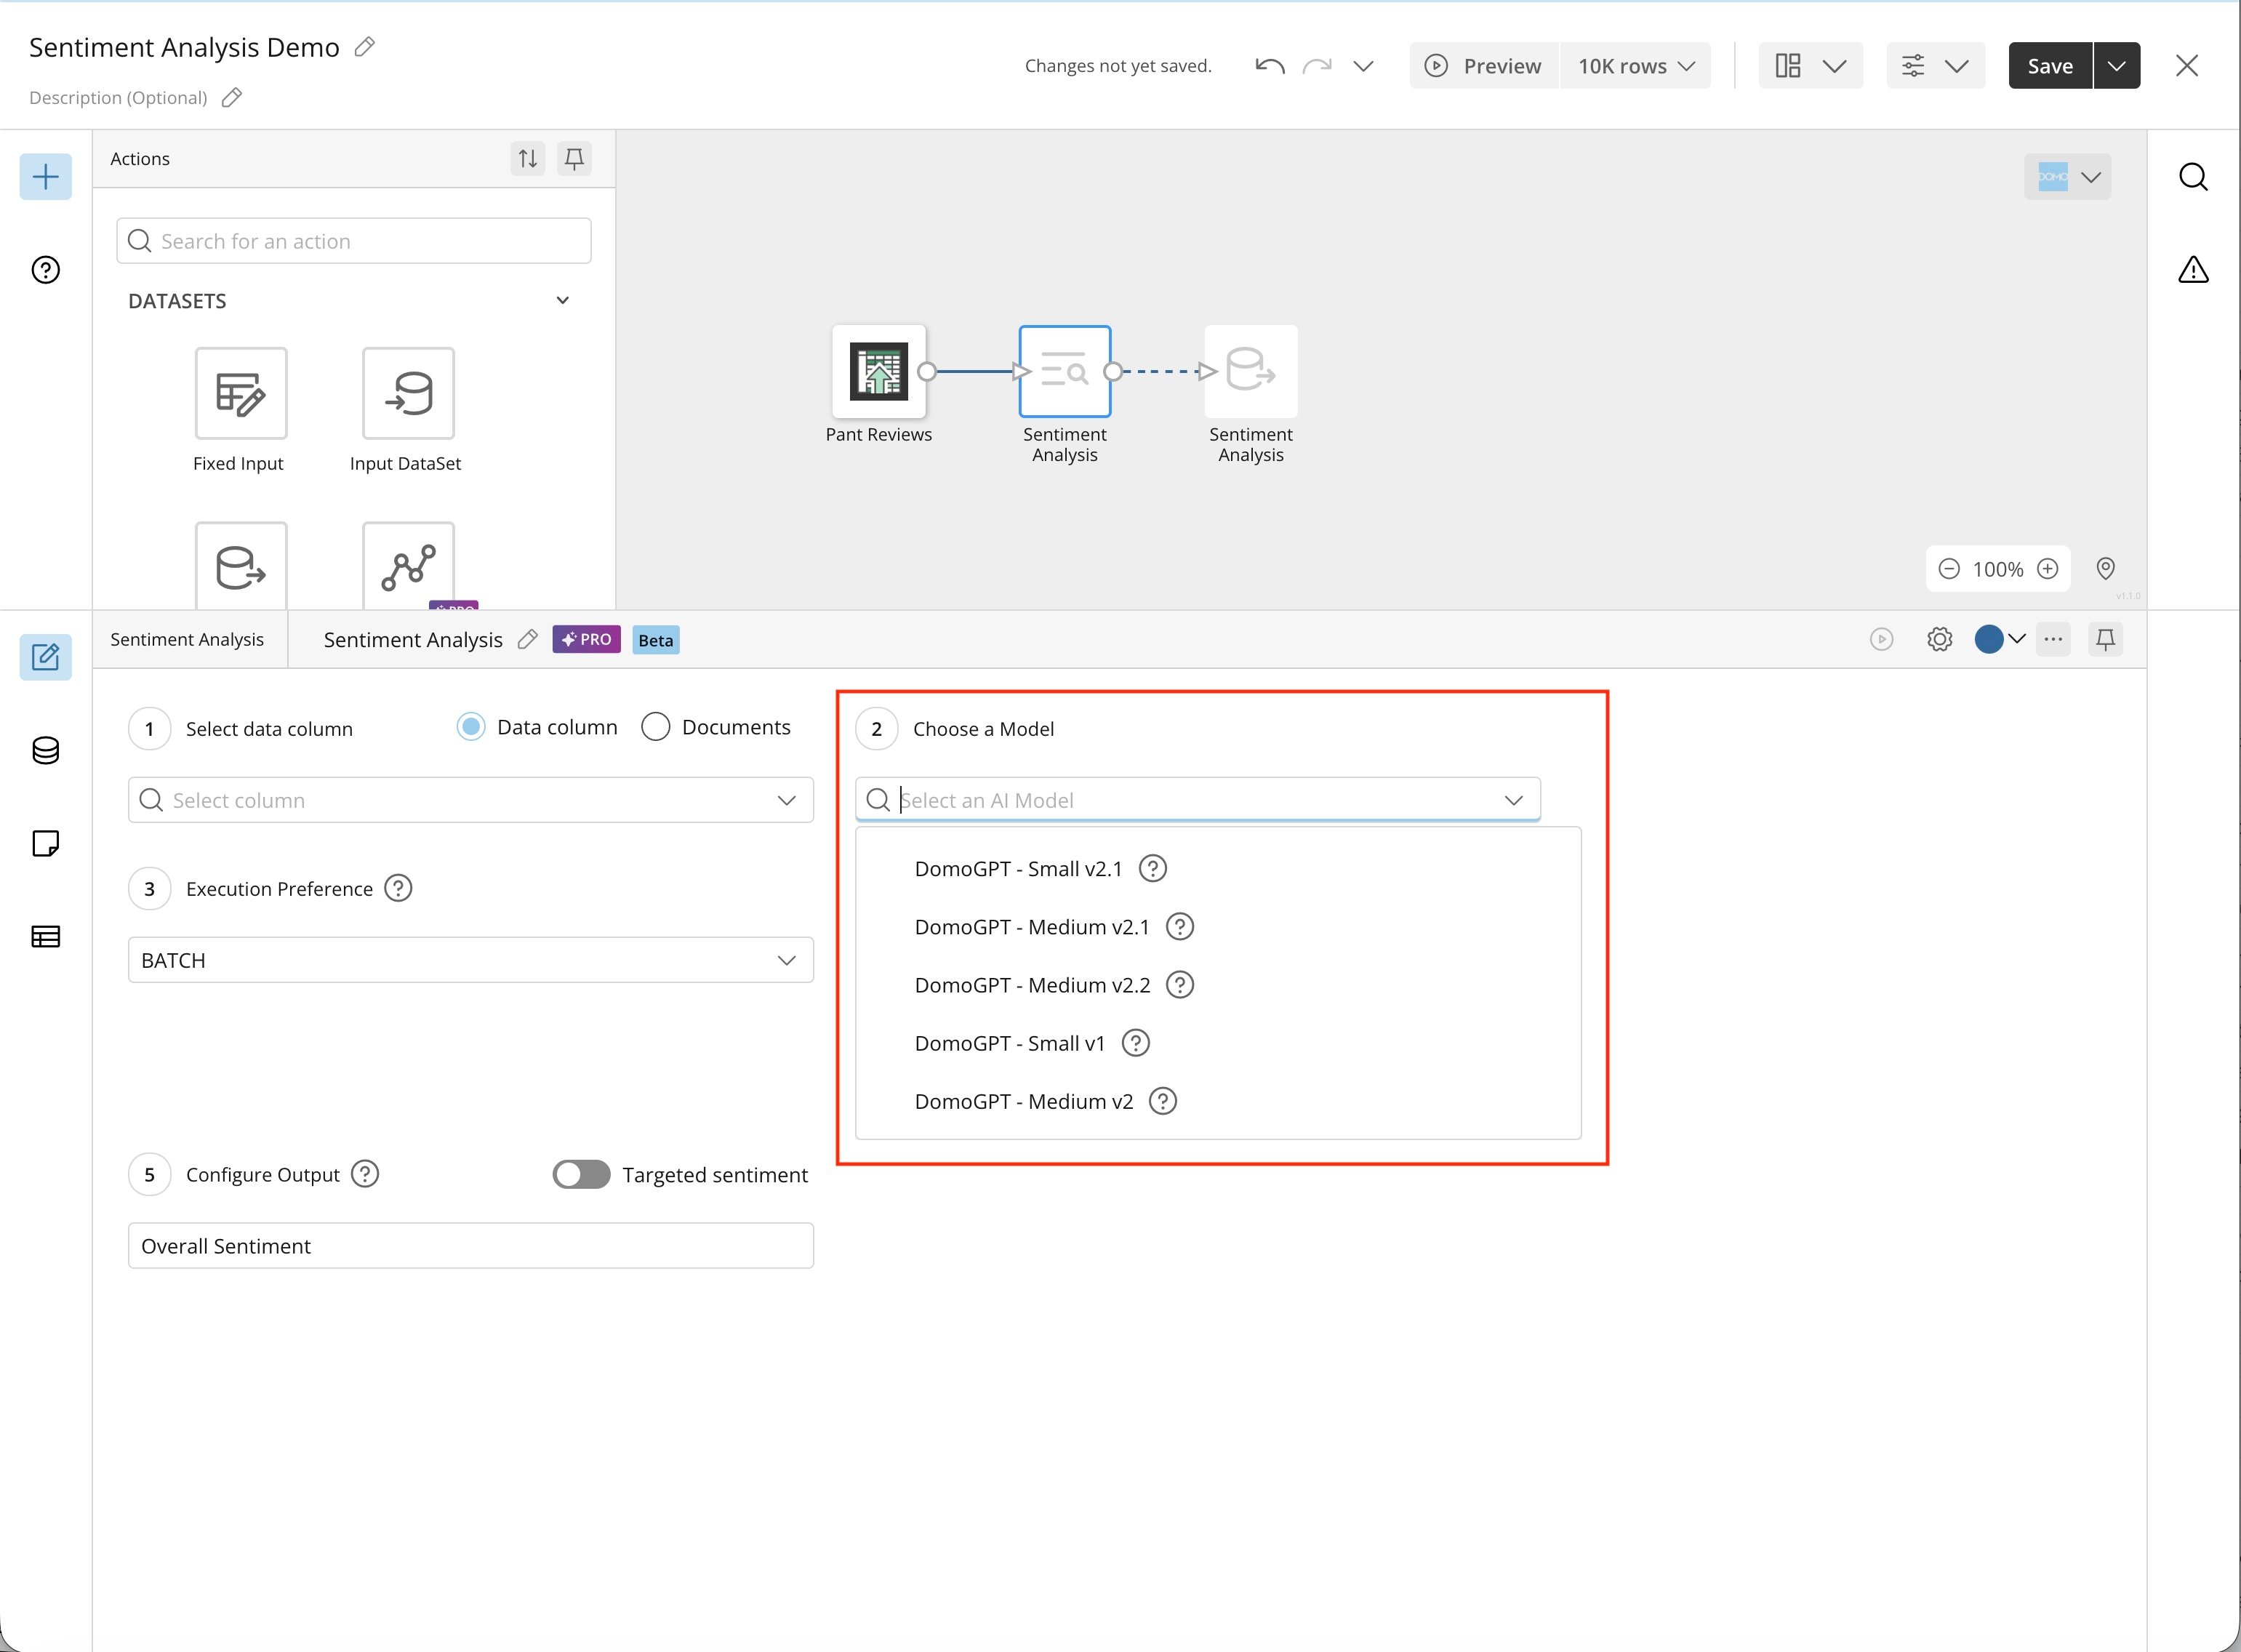 5\. Choose the Execution Preference.
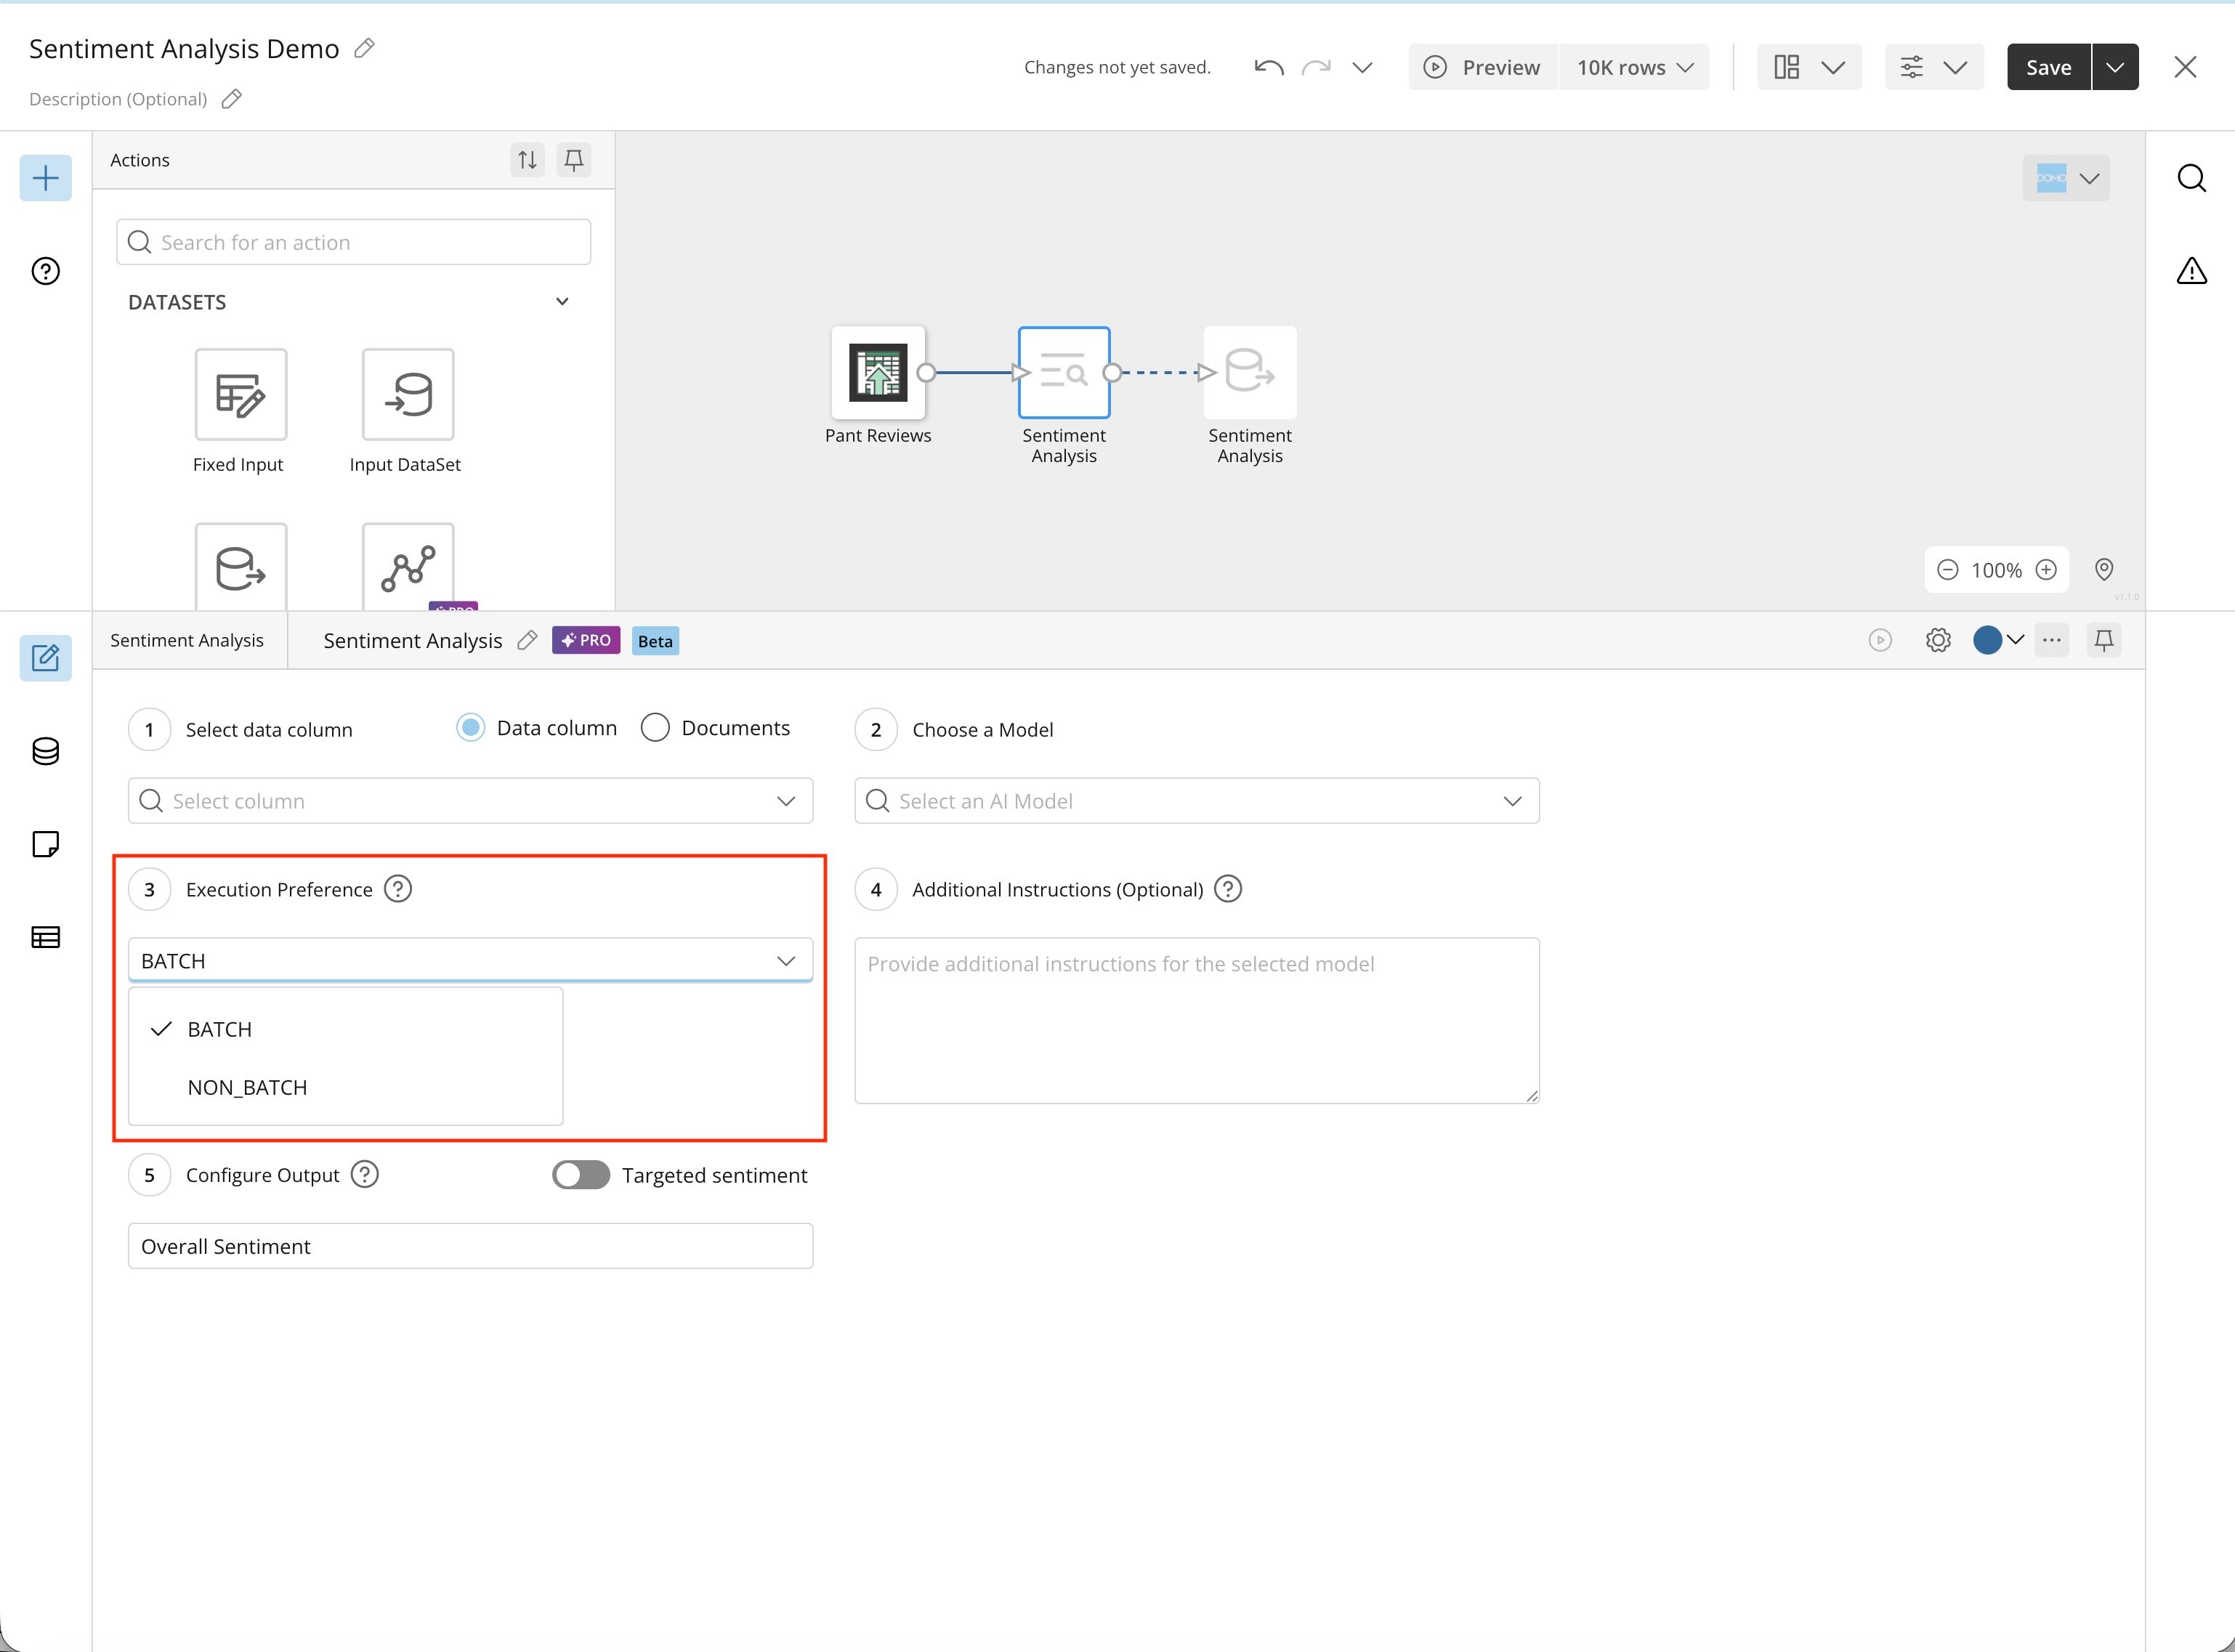 **Note:** Batch and non-batch processing differ primarily in latency, cost, and use case.
Batch processing is designed for high-volume, asynchronous workloads, so execution times vary. It's generally more cost-effective.
Non-batch processing is intended for more consistent execution times with a small number of rows. Non-batch is always used when processing fewer than 100 rows of data.
6. Provide the model with any additional instructions on how to analyze the column. Be very
specific; describe exactly what you want the model to do (and not to do).
**Tip:** Constructing a prompt that returns the results you need is a skill
that takes time and practice.
**Note:** Batch and non-batch processing differ primarily in latency, cost, and use case.
Batch processing is designed for high-volume, asynchronous workloads, so execution times vary. It's generally more cost-effective.
Non-batch processing is intended for more consistent execution times with a small number of rows. Non-batch is always used when processing fewer than 100 rows of data.
6. Provide the model with any additional instructions on how to analyze the column. Be very
specific; describe exactly what you want the model to do (and not to do).
**Tip:** Constructing a prompt that returns the results you need is a skill
that takes time and practice.
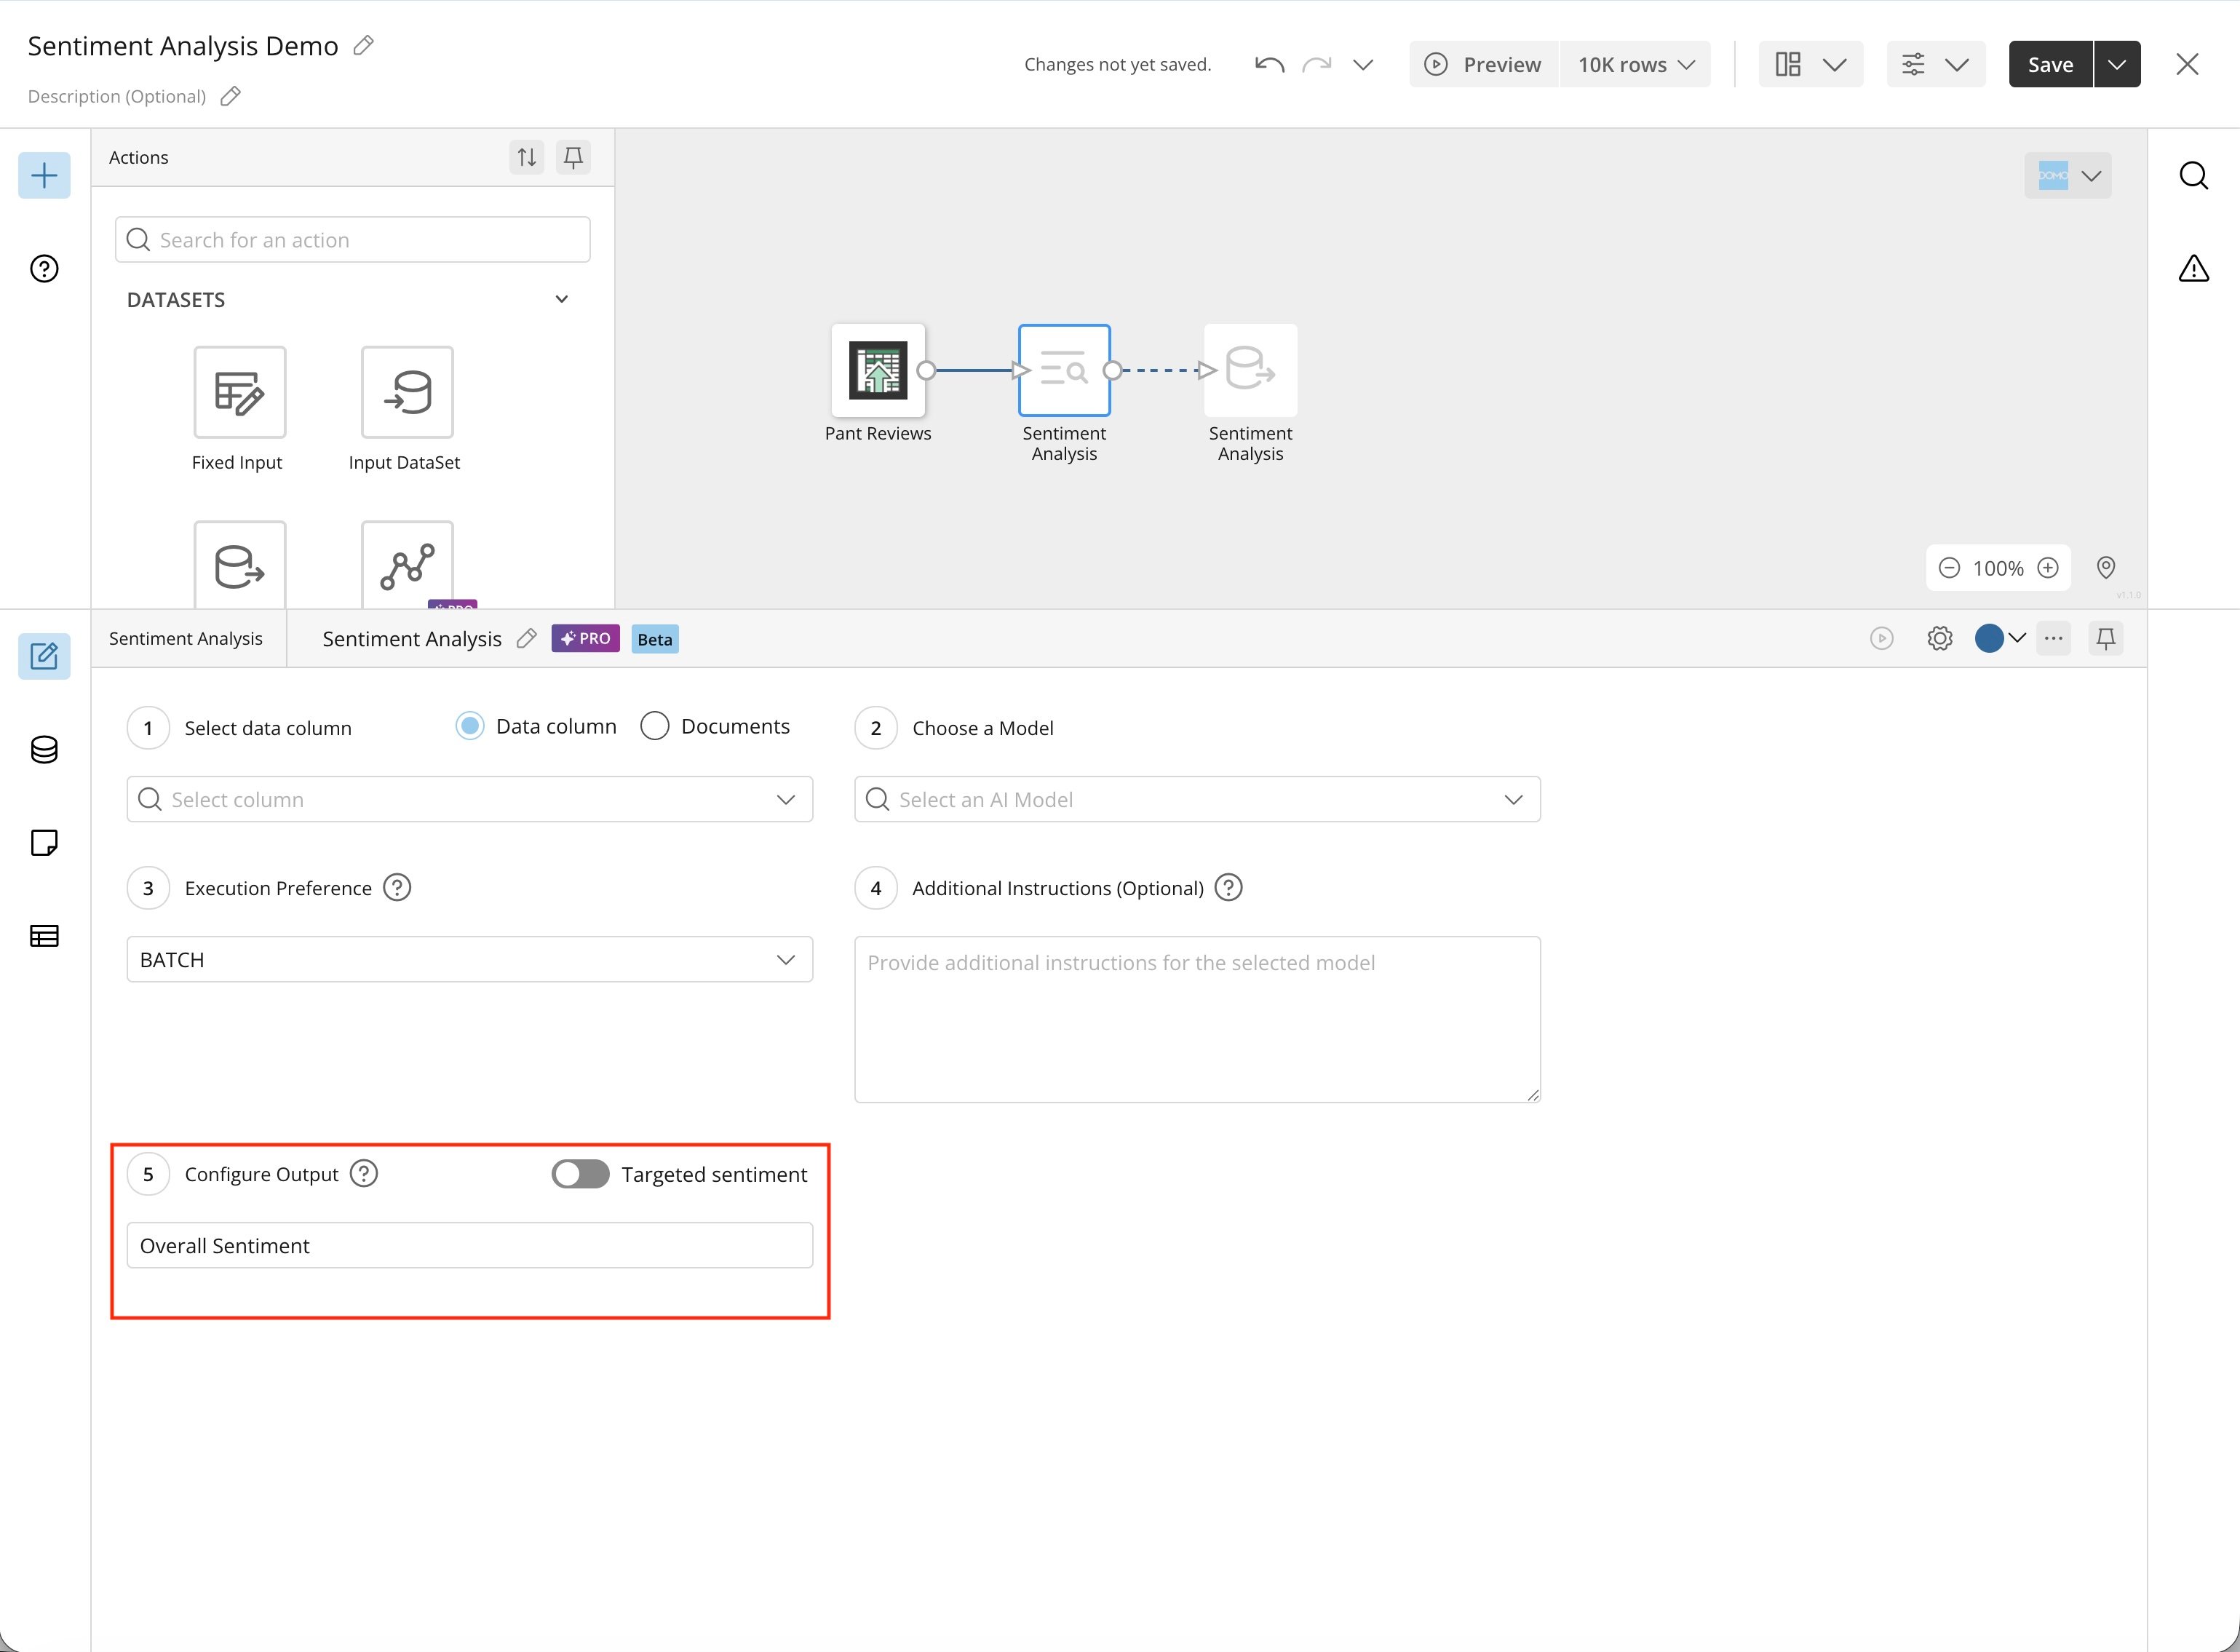
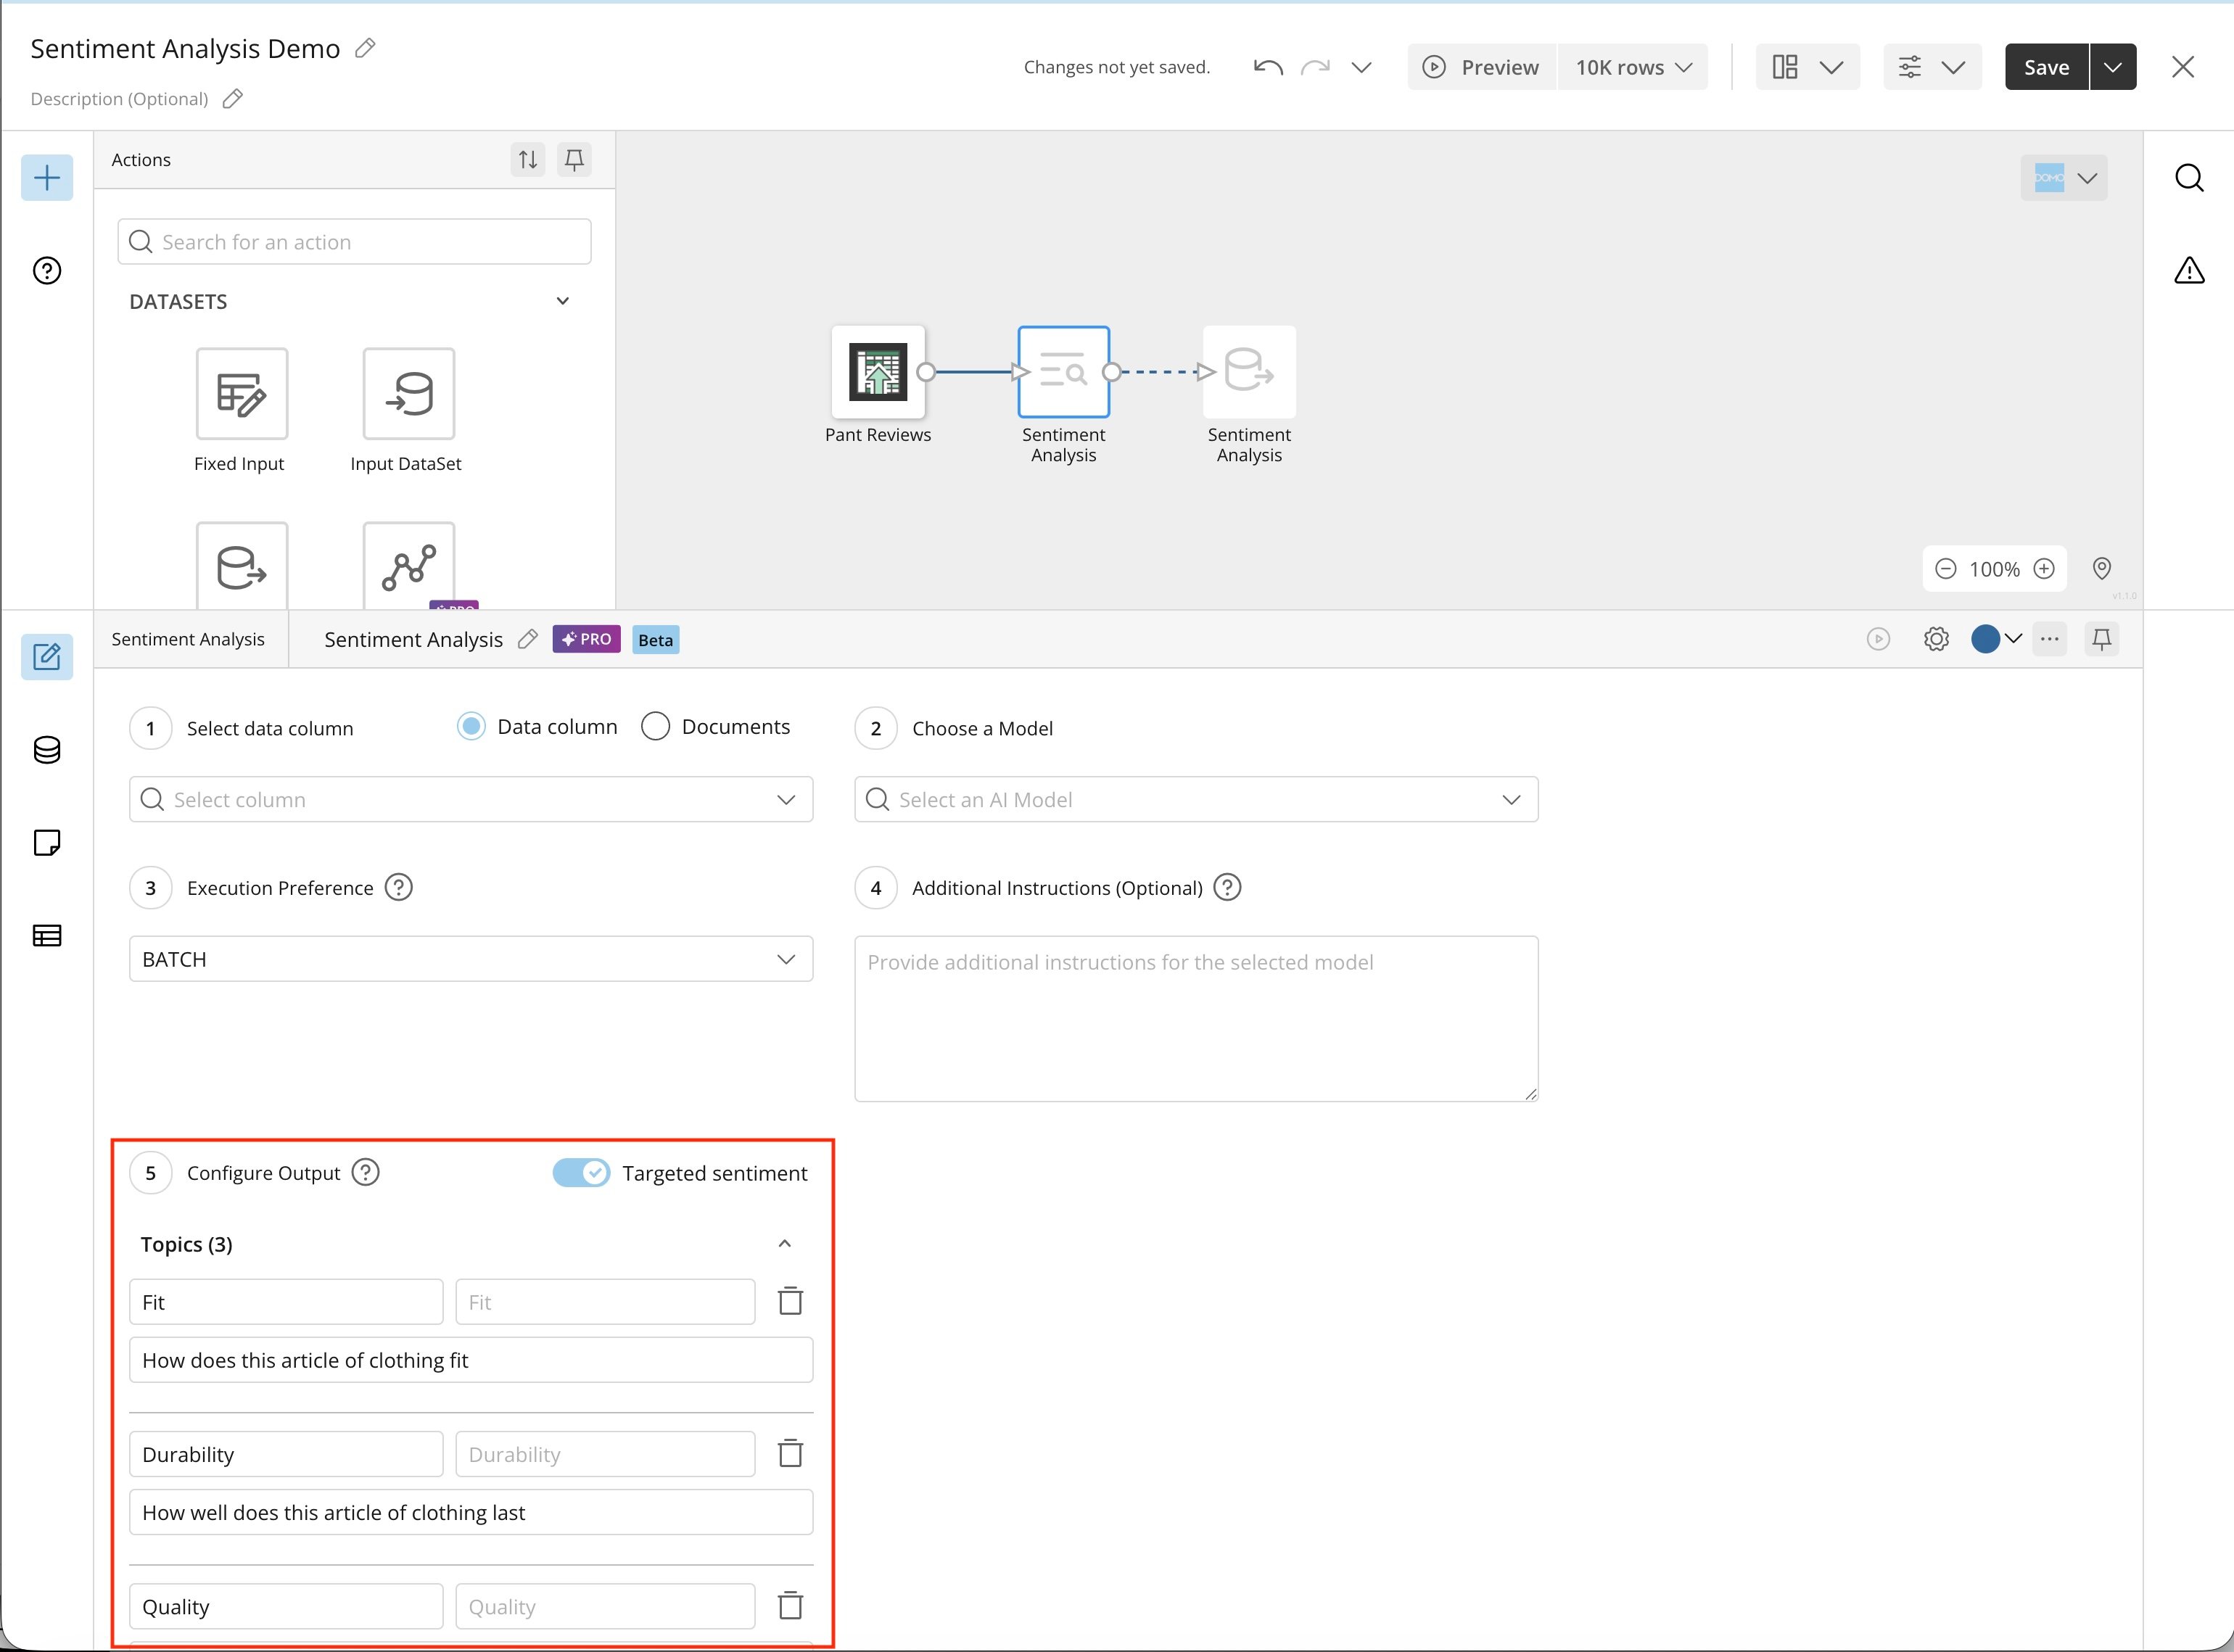
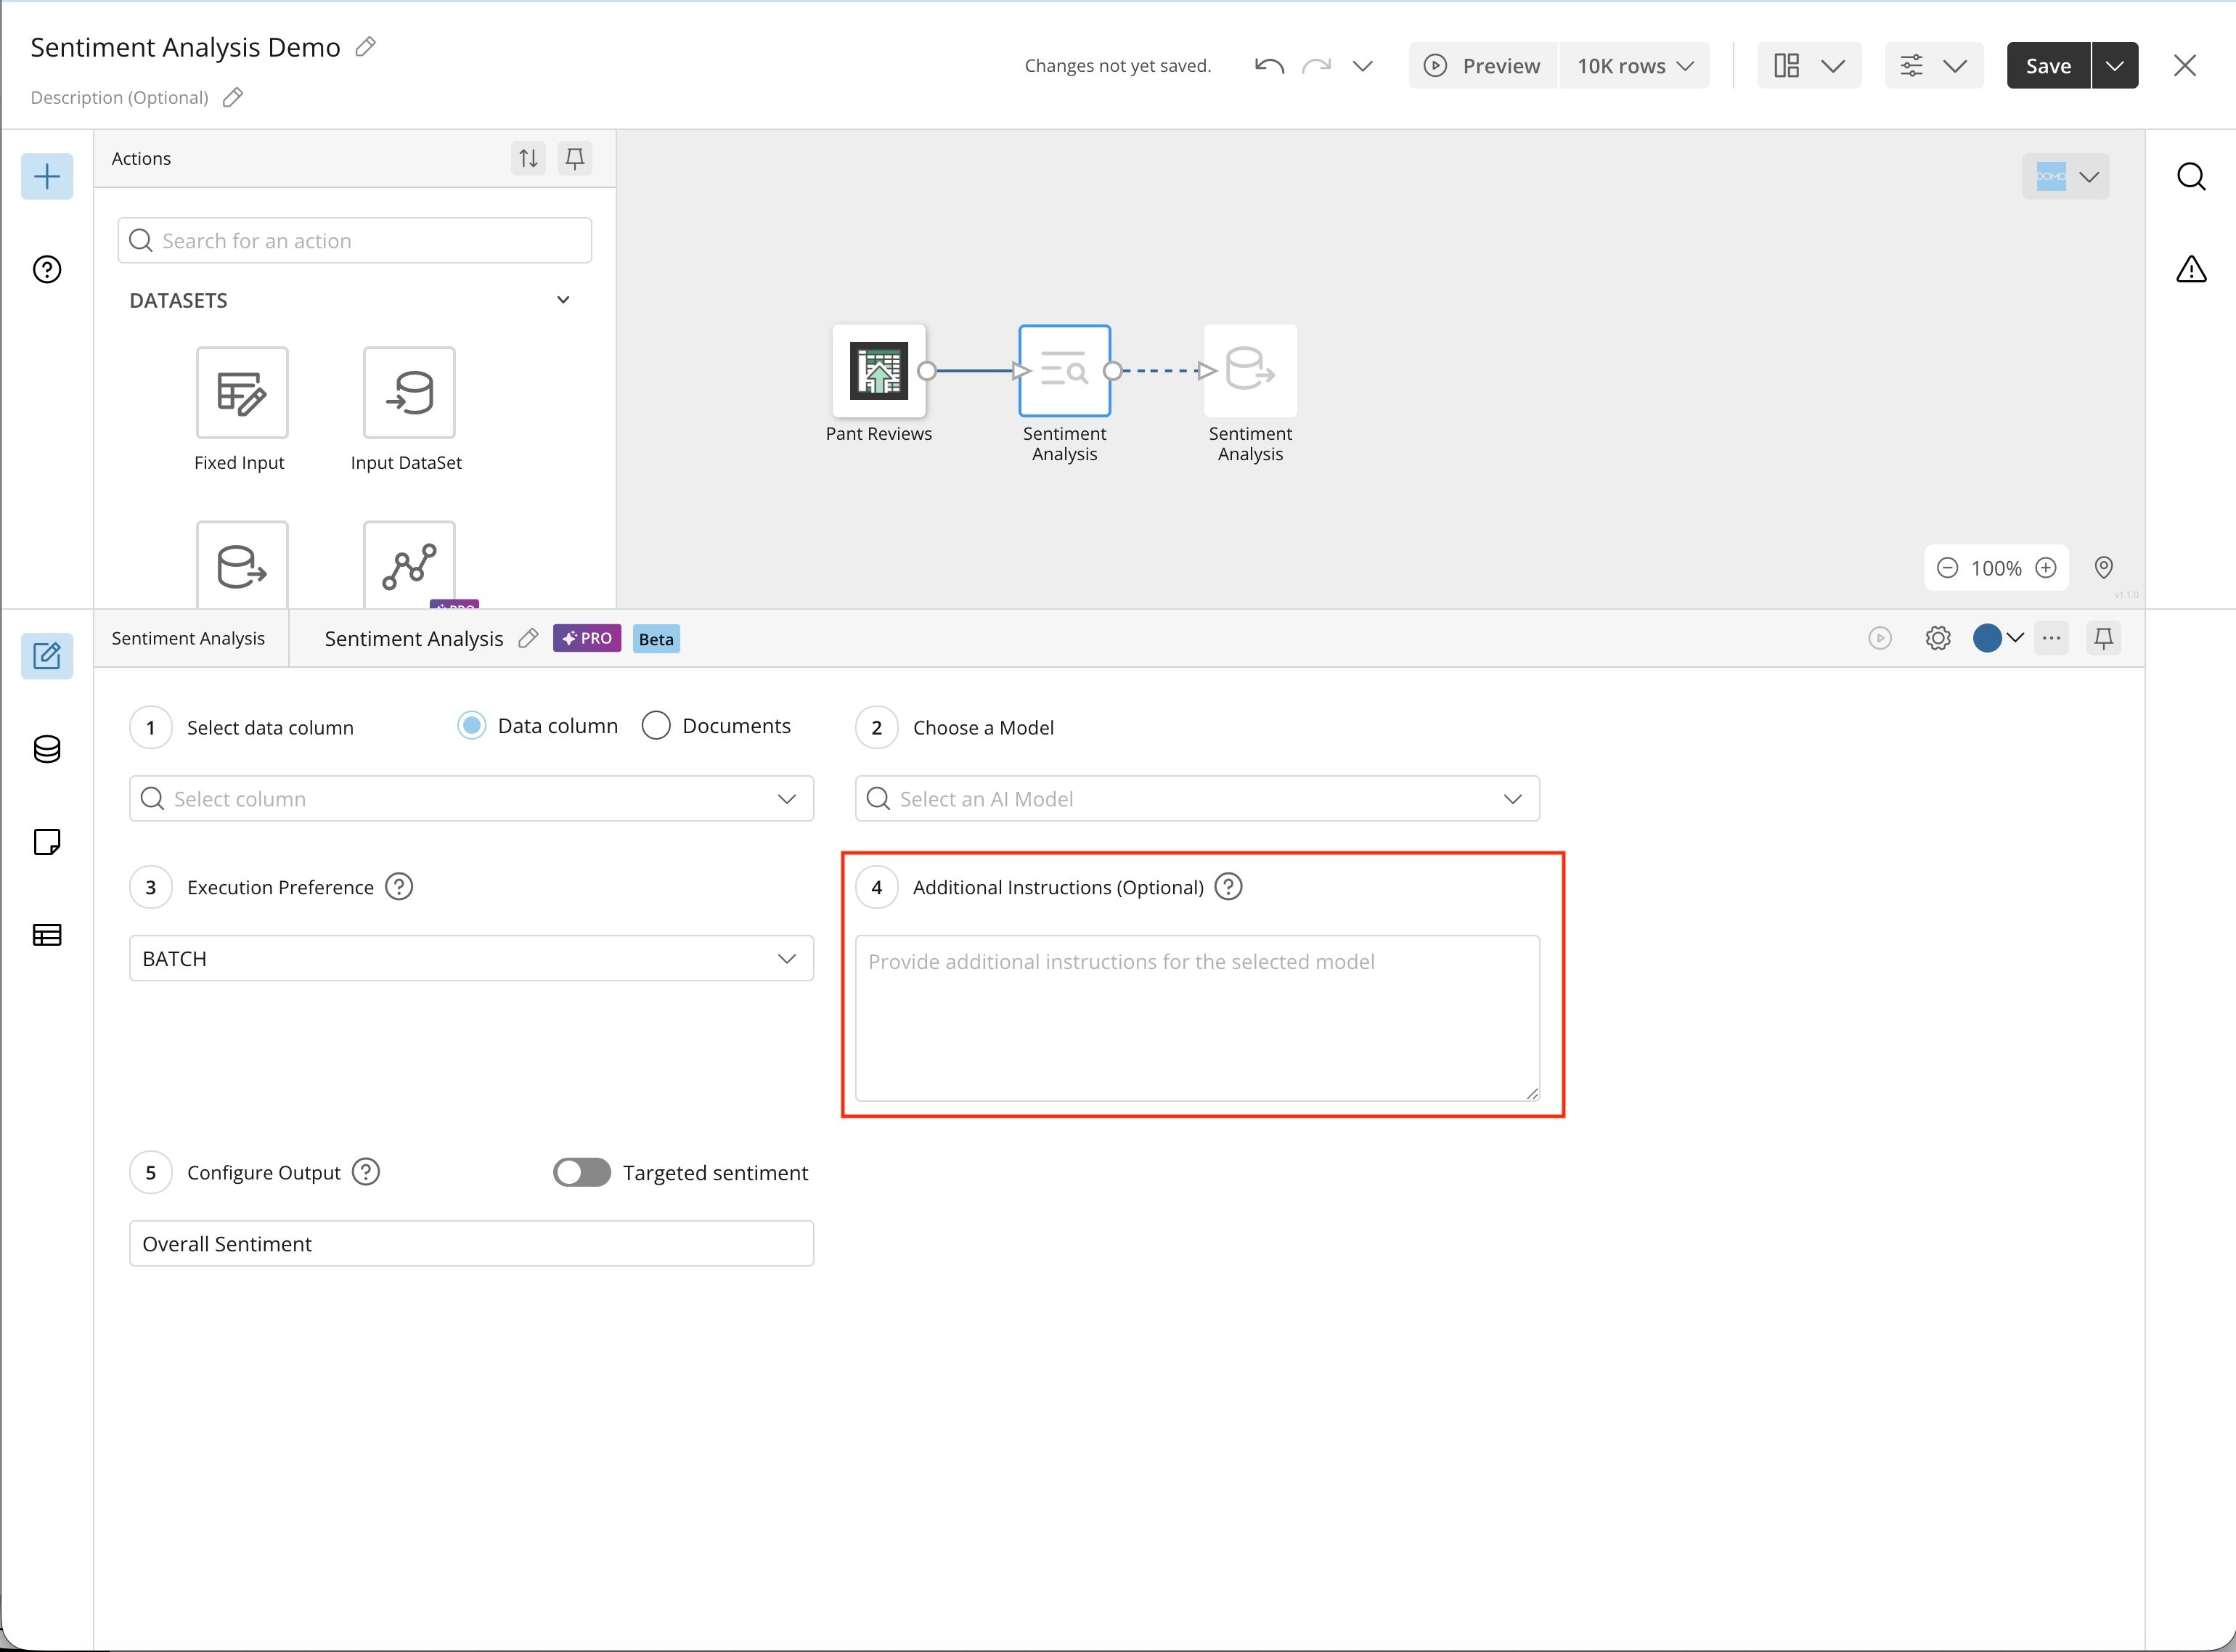 7\. Configure the desired output—**Overall Sentiment** or **Targeted Sentiment**.
* **Overall Sentiment** returns a single sentiment value for the text:
```
Overall Sentiment = Positive
```
* **Targeted Sentiment** returns a sentiment value for each topic you specify (for example, overall, fit, durability, and customer service):
```
Overall Sentiment = Positive
Fit = Neutral
Durability = Positive
Customer Service = Positive
```
7\. Configure the desired output—**Overall Sentiment** or **Targeted Sentiment**.
* **Overall Sentiment** returns a single sentiment value for the text:
```
Overall Sentiment = Positive
```
* **Targeted Sentiment** returns a sentiment value for each topic you specify (for example, overall, fit, durability, and customer service):
```
Overall Sentiment = Positive
Fit = Neutral
Durability = Positive
Customer Service = Positive
```
 After the Sentiment Analysis tile executes, it adds a sentiment column or columns to your DataSet. You can use tiles farther downstream in the DataFlow to rename that column(s).
**Consumption Ramifications:**
* AI Operations: 1 operation per tile
* Tokens: input and output tokens vary based on the prompt and the data volume processed
**Notes:**
* You can include multiple Sentiment Analysis tiles in the same DataFlow, tasking them with different aspects of analysis for the column (or analysis of different columns).
## FAQ
Not currently, but this capability is on the roadmap.
Yes, you can enable Targeted Sentiment.
After the Sentiment Analysis tile executes, it adds a sentiment column or columns to your DataSet. You can use tiles farther downstream in the DataFlow to rename that column(s).
**Consumption Ramifications:**
* AI Operations: 1 operation per tile
* Tokens: input and output tokens vary based on the prompt and the data volume processed
**Notes:**
* You can include multiple Sentiment Analysis tiles in the same DataFlow, tasking them with different aspects of analysis for the column (or analysis of different columns).
## FAQ
Not currently, but this capability is on the roadmap.
Yes, you can enable Targeted Sentiment.