Setting the Minimum or Maximum Value for Your Chart
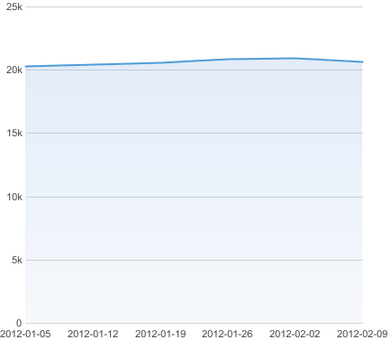
When you create a card, Domo sets the minimum value scale value to 0 and automatically determines a plausible maximum value based on the highest value in your DataSet. For most charts this is optimal. However, in some instances you may want to change either the minimum or maximum value to present the data more understandably. For example, in the following chart, all of the values are in the range of 20,000 to 21,000. Because the minimum value is automatically set to 0, it is difficult to see changes in the data.
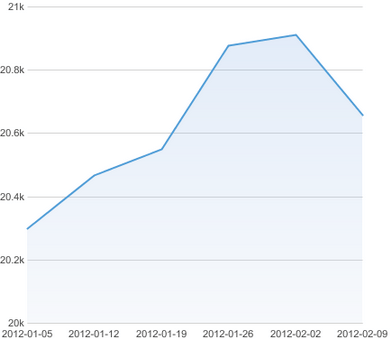
You can get around this by indicating the minimum and/or maximum values on your value scale. In the preceding chart, for example, you could set the minimum value to “20,000” and the maximum value to “21,000.” This shrinks the range of data down far enough that you can see the changes in the data. The following chart shows the same data as in the preceding screenshot, but the minimum and maximum values have been changed to accommodate the narrow range of data.
To set the minimum or maximum value on a value scale,
Open the Analyzer for the chart you want to edit.
In Chart Properties, click Value Scale.
Enter the desired minimum and/or maximum values in the Min and Max fields, respectively.
Video - Changing the Value Scale in Cards
Assistant
Responses are generated using AI and may contain mistakes.