

Intro
This article describes how to use the AI Services tiles in Magic ETL. To learn how to use tiles in DataFlows, see Create a Magic ETL DataFlow.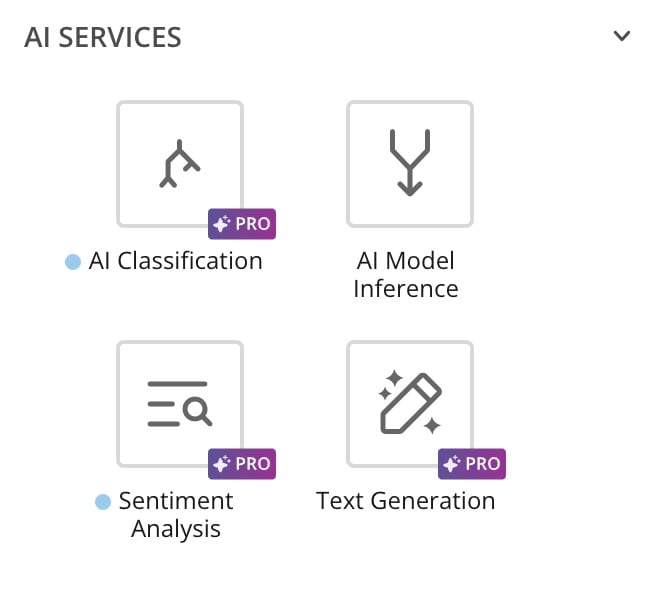
AI Forecasting Tile

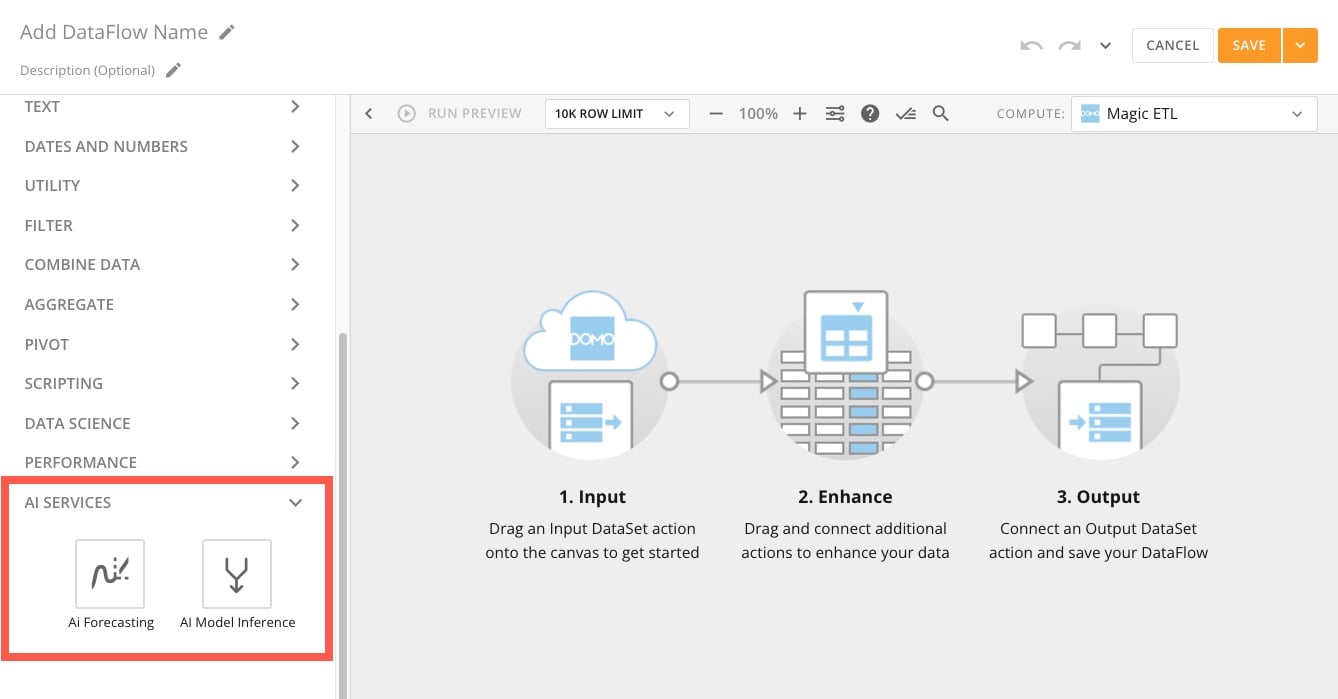
Configure the AI Forecasting Tile
After you connect your input DataSet to an AI Forecasting tile on the Magic ETL canvas, you can configure your model preferences. Select the AI Forecasting tile to expand the tile editor. Complete the steps in the editor.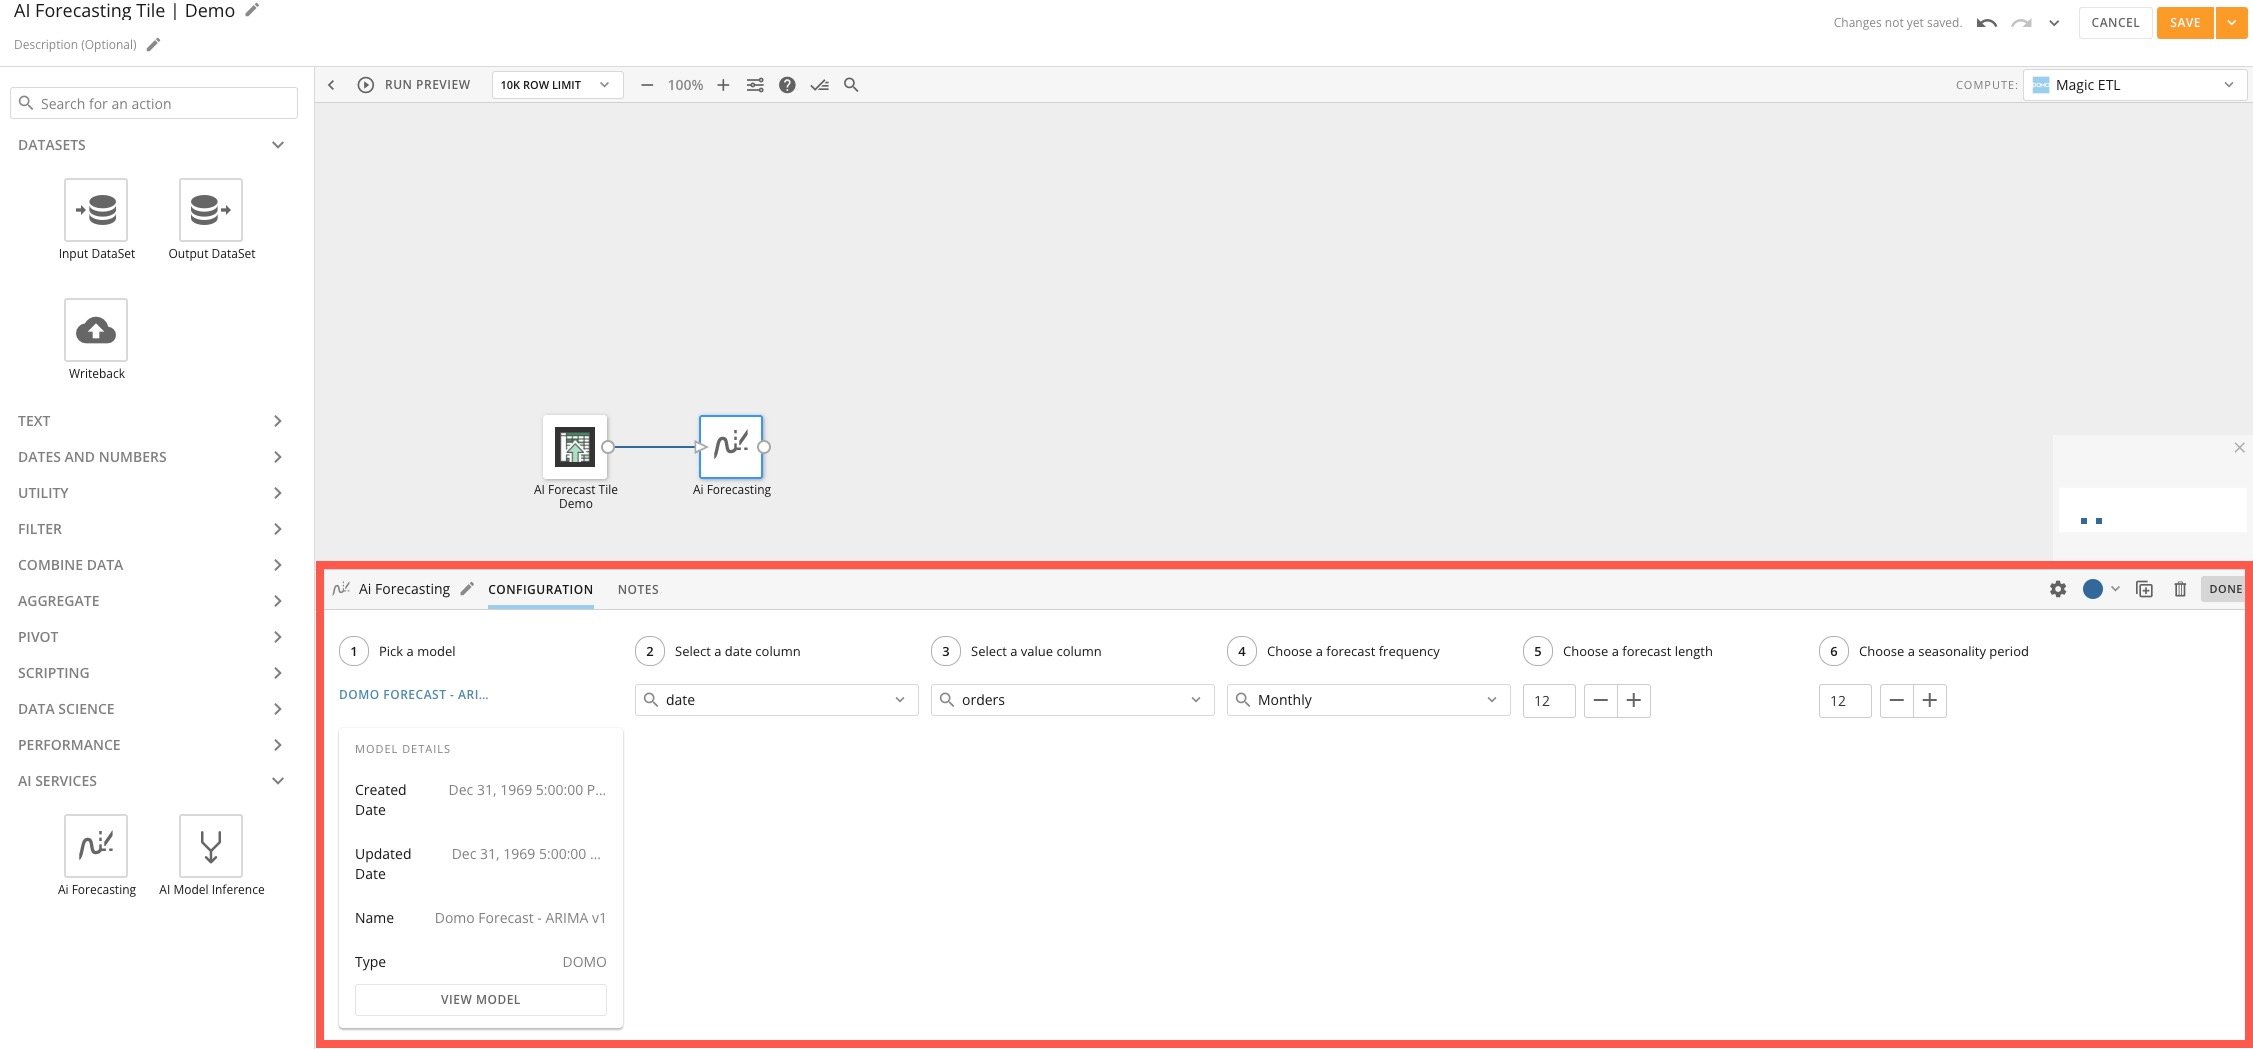
Learn more about models.
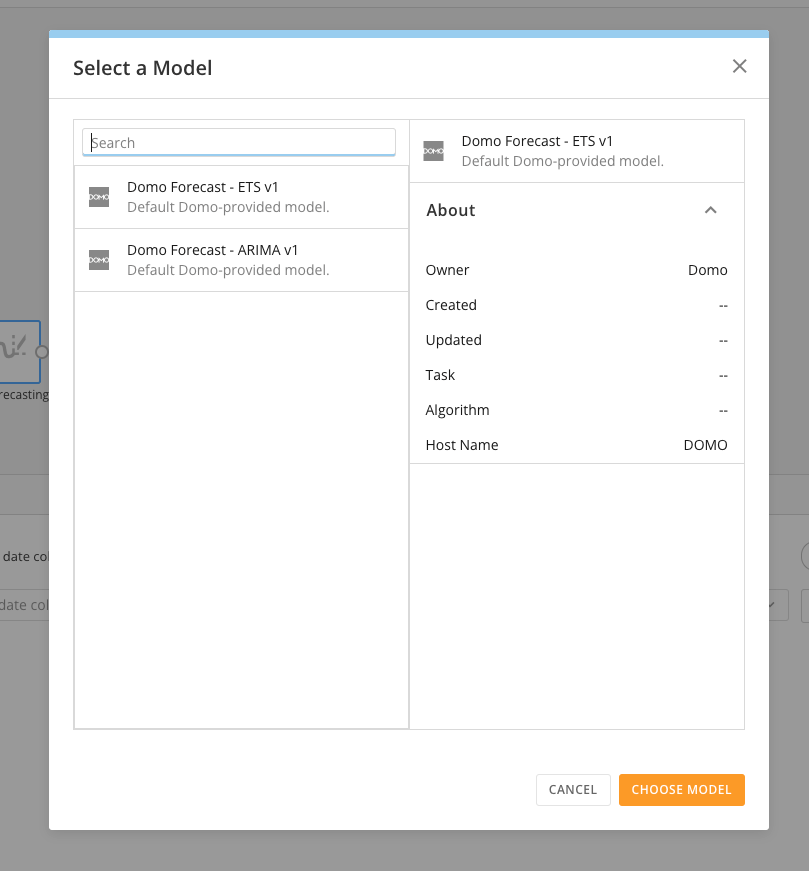
After configuring the AI Forecasting tile, finish configuring your Magic ETL DataFlow and create the output Dataset.
Note: The number of rows in your output DataSet depends on the number of
data points you configured to be forecasted.
Configure Your AI Forecasting Tile to Match Its Input Granularity
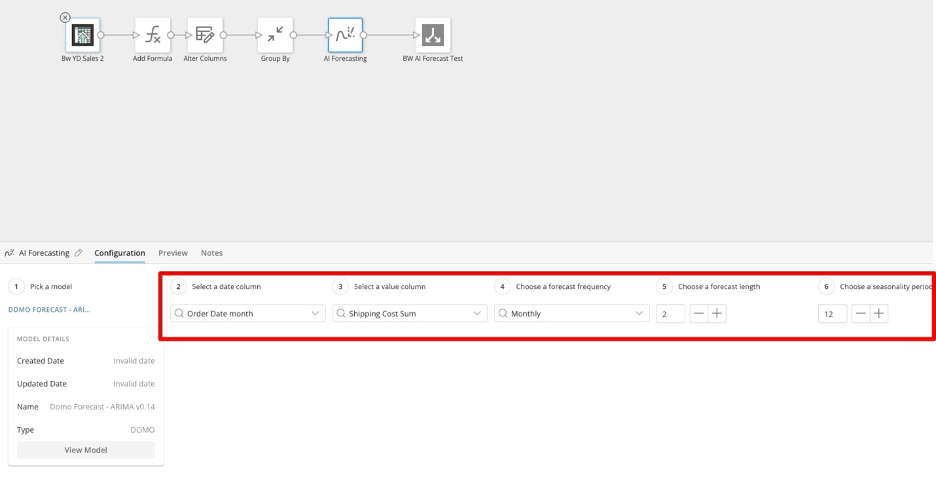
Drag and drop an AI Forecasting tile onto the authoring canvas and connect to your DataFlow. Select the AI Forecasting tile to expand the tile editor. Select Configuration (tab). Adjust your date and value columns, then choose a forecast frequency and length, and select a seasonality period—all according to your specified granularity.For example, if you are ordering granularity by month, you can select your configured column “Order Date Month,” a value sum, a “Monthly” frequency, and a seasonality period of “12.”
Interpret Results from the AI Forecasting Tile
You can interpret and explore the results of your forecast by opening the output DataSet in Analyzer. Use the chart type finder to choose a Forecasting Chart. Use the upper and lower bound columns from your output DataSet to set your bounds and display the forecast confidence ranges. Learn more about the Forecasting Chart.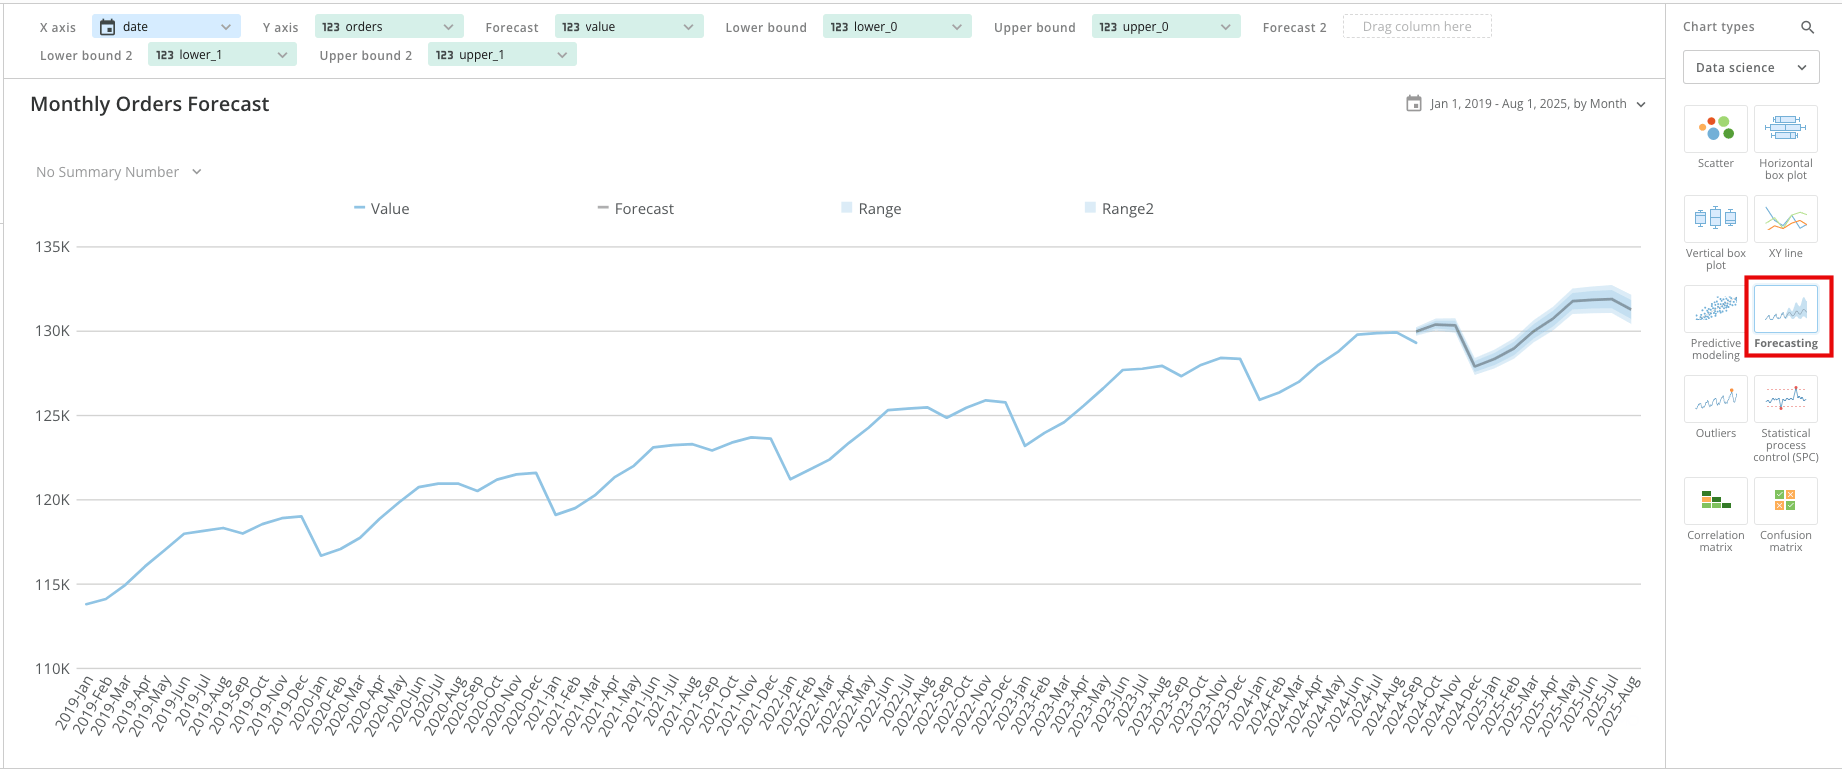
Convert Input Granularity
Follow the steps below to convert your input DataSet from a minute granularity to a month/day or other specific granularity when creating a DataFlow with the AI Forecasting tile.Add a Granularity Formula
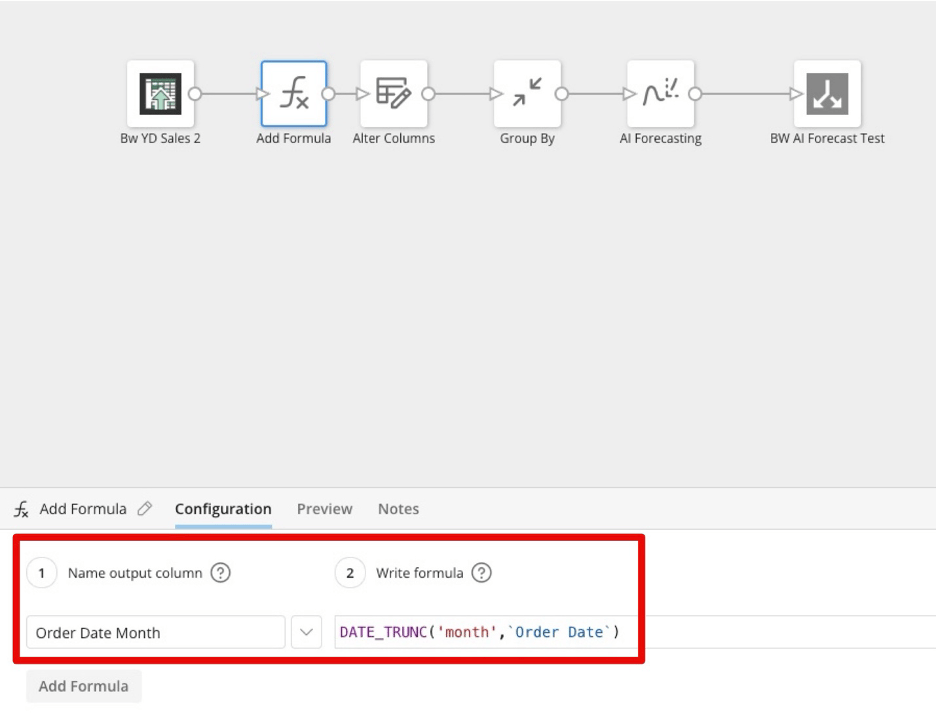
Drag and drop an Add Formula tile onto the authoring canvas. Connect that tile to your DataSet. Select the Add Formula tile to expand the tile editor. Select Configuration (tab). Enter a name in the Name output column field.For example, to create a column granularity by month, you can enter “Order Date Month.” Enter the corresponding formula in the Write formula field.
For example, to order granularity by month, you can write
DATE_TRUNC ('month', 'Order Date').
Alter Your Column Granularity
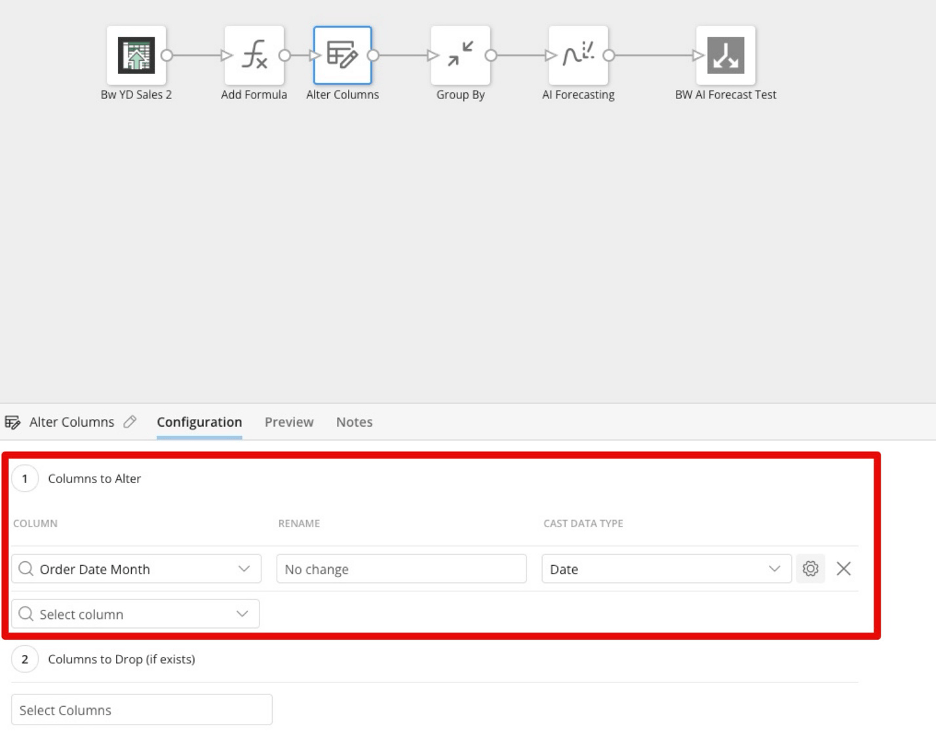
Drag and drop an Alter Columns tile onto the authoring canvas. Connect that tile to your DataFlow. Select the Alter Columns tile to expand the tile editor. Select Configuration (tab). Alter applicable columns.For example, to order granularity by month, you can select the “Order Date Month” column you created with your granularity formula.
Then, change the Cast Data Type to “Date.”
Group Your Column by Granularity
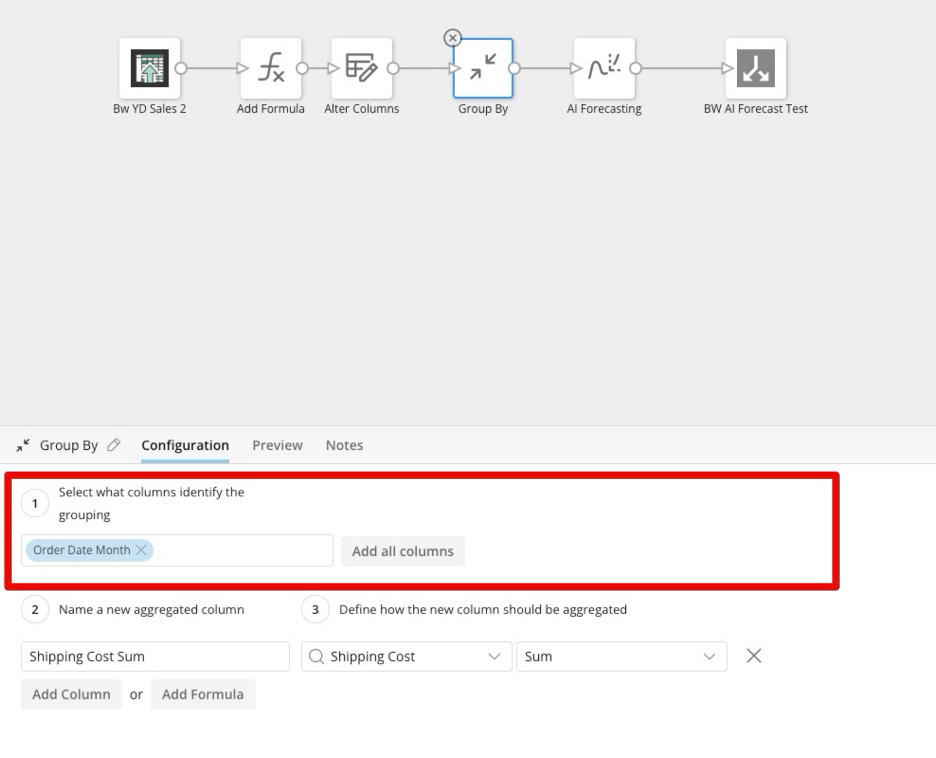
Drag and drop a Group By tile onto the authoring canvas. Connect that tile to your DataFlow. Select the Group By tile to expand the tile editor. Select Configuration (tab). Select the applicable columns.For example, to order granularity by month, you can select the “Order Date Month”column you created and altered in the Add Formula and Alter Columns tiles. You now have a column that you have altered and grouped according to your specified granularity.
Configure Your AI Forecasting Tile to Match Its Input Granularity
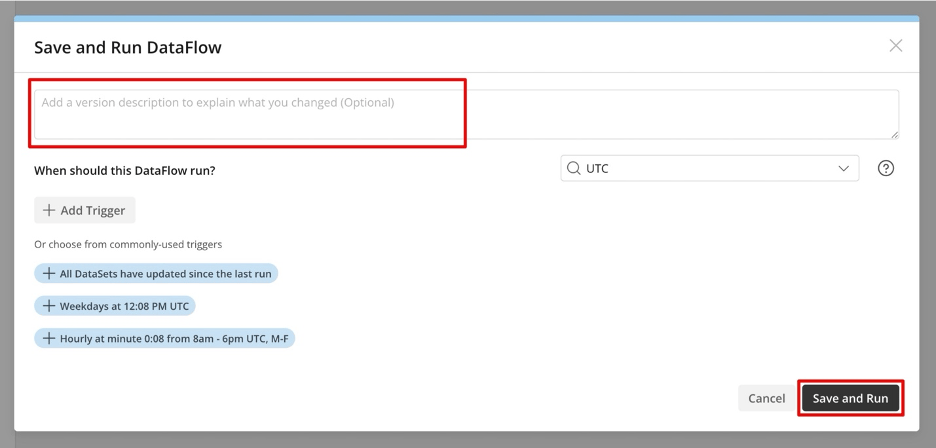
Drag and drop an AI Forecasting tile onto the authoring canvas and connect to your DataFlow. Select the AI Forecasting tile to expand the tile editor. Select Configuration (tab). Adjust your date and value columns, then choose a forecast frequency and length, and select a seasonality period—all according to your specified granularity.For example, if you are ordering granularity by month, you can select your configured column “Order Date Month,” a value sum, a “Monthly” frequency, and a seasonality period of “12.”
Save Your Granularity Configuration
Select Save to save your configuration. You can also check your work by selecting the dropdown next to Save and selecting Save and Run.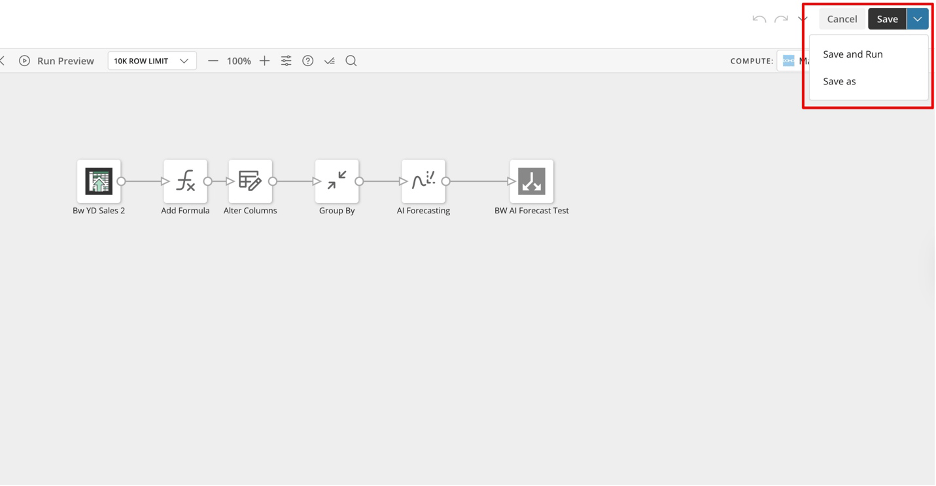
AI Model Inference Tile

Required Grant
To access the AI Model Inference tile in Magic ETL, the following grant must be enabled for your role:- **Use AI Services —**Allows a user to access and use the AI Services in Domo.
Configure the AI Model Inference Tile
- Select the DataSet you want to gather inferences from and open it in Magic ETL.
-
In the Magic ETL sidebar, expand Data Science and drag an AI Model Inference tile to the canvas.
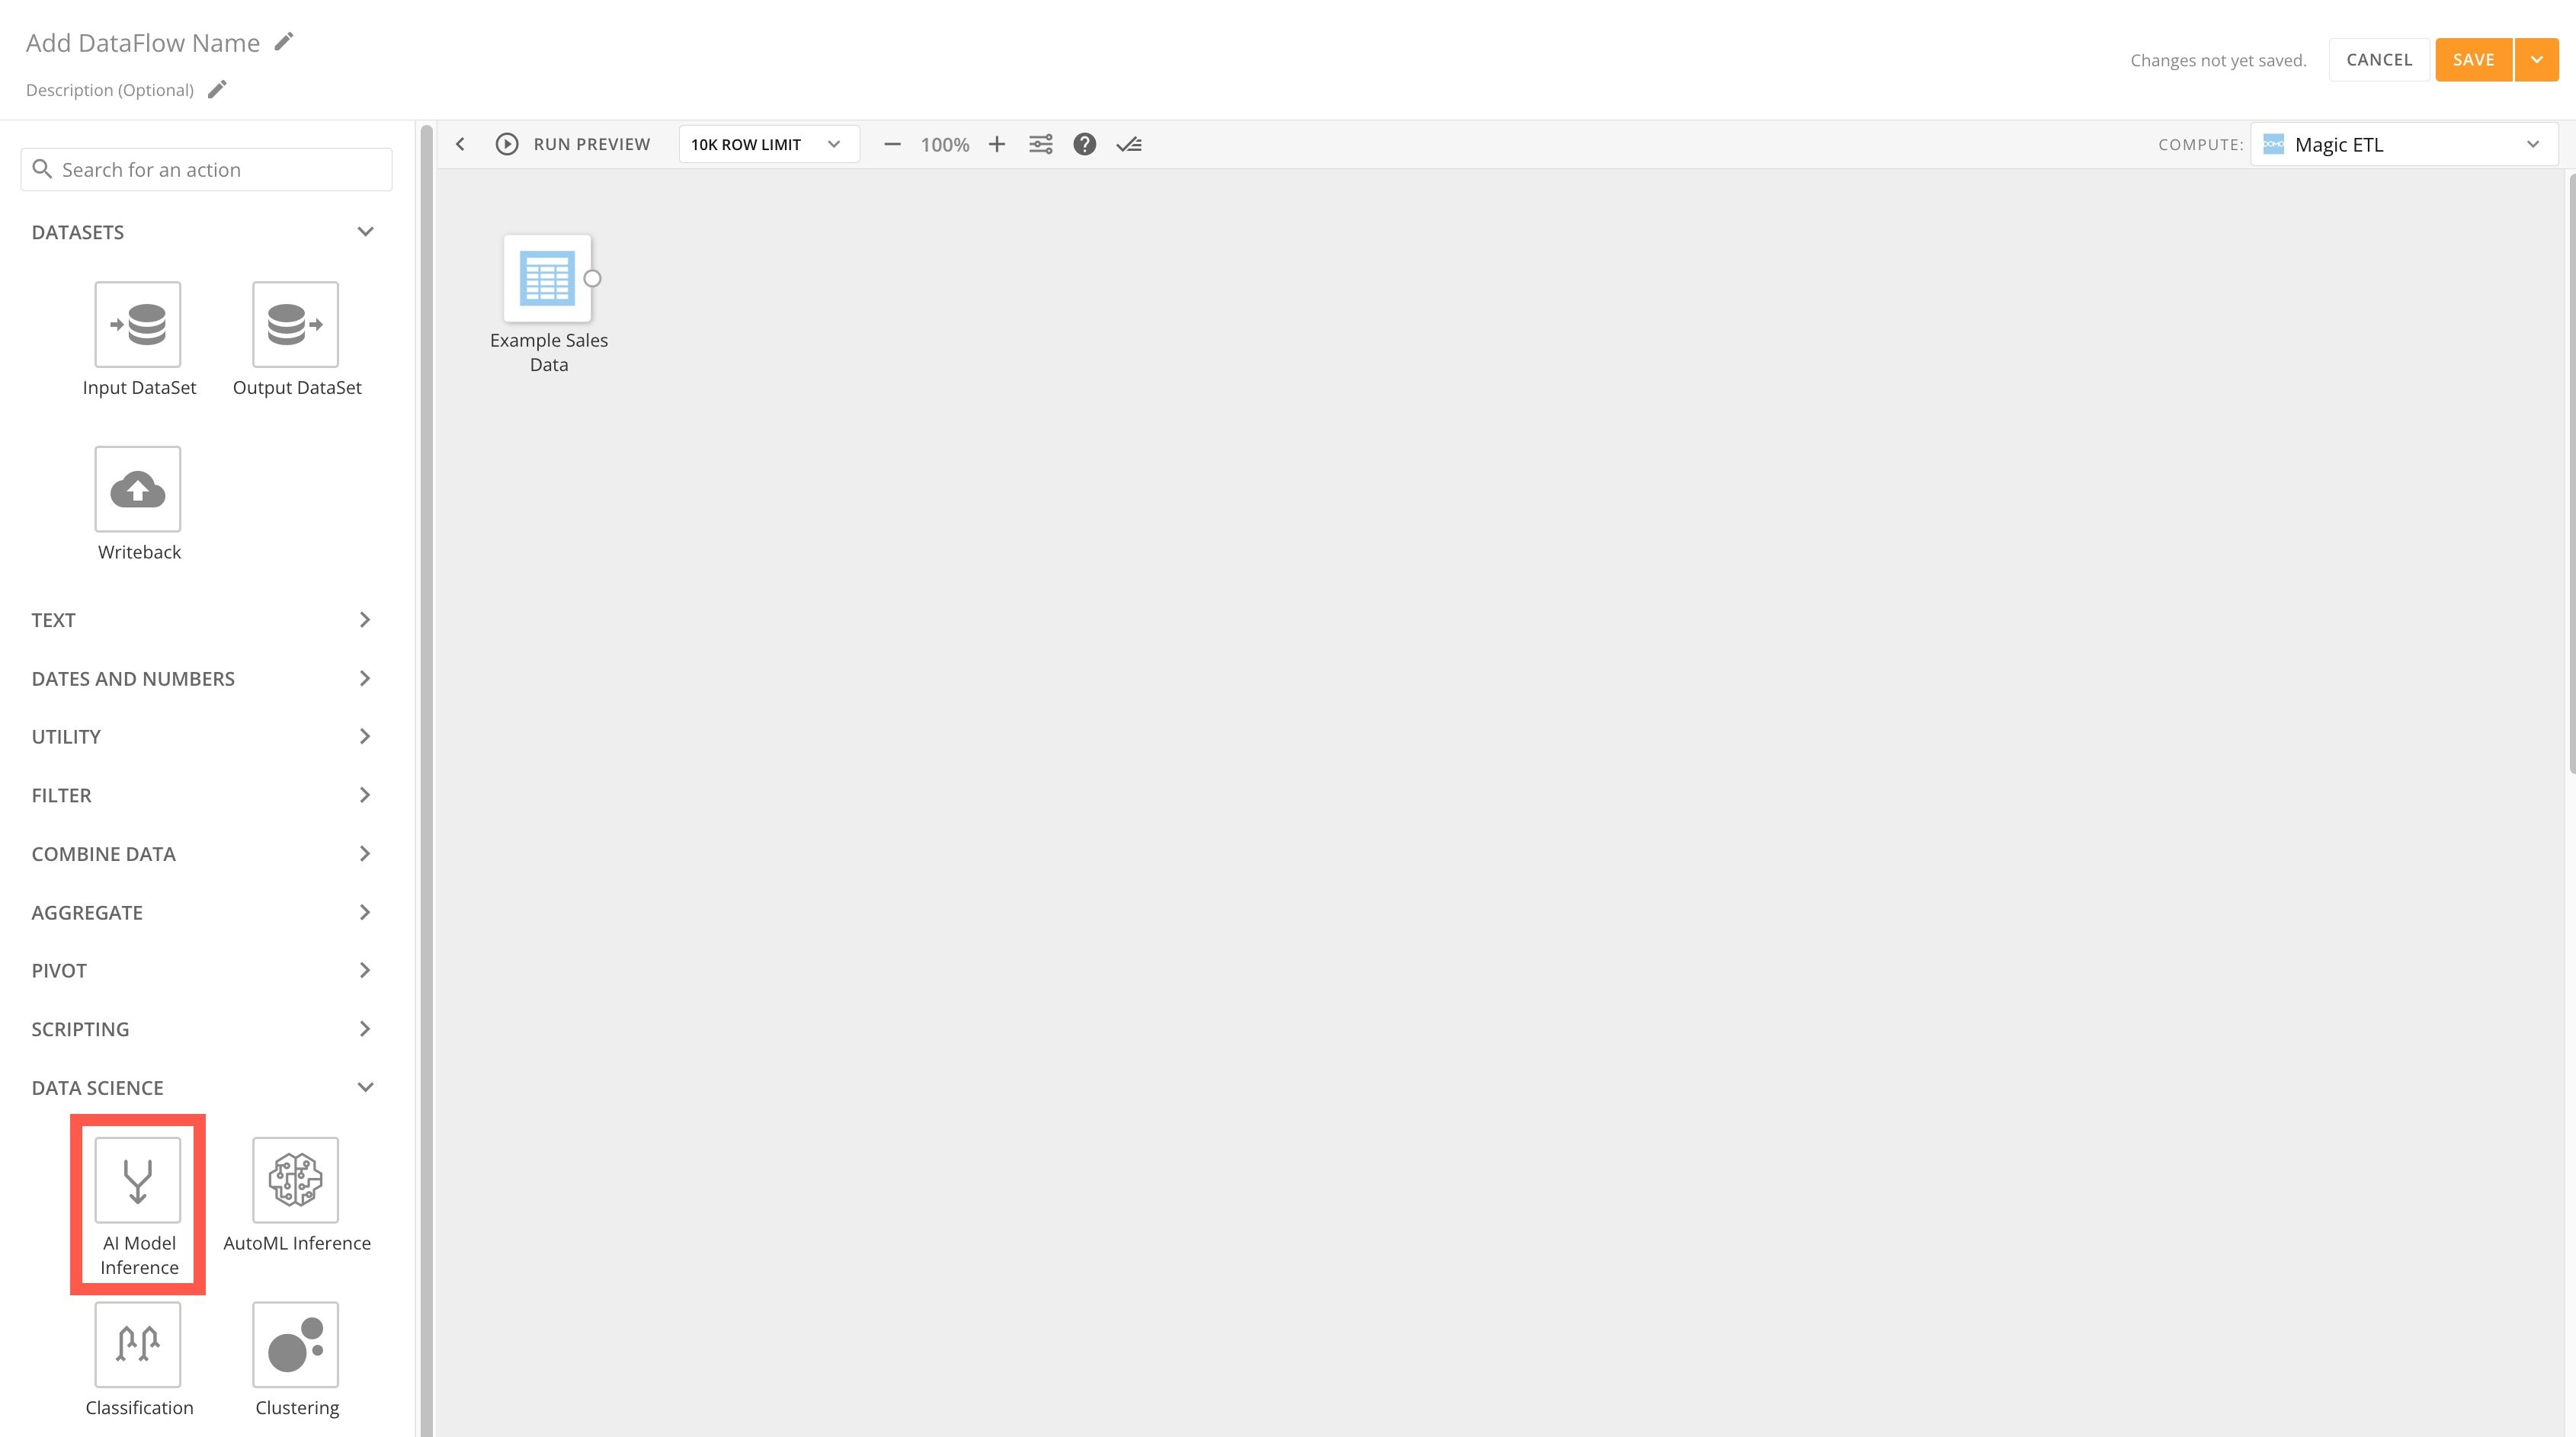
- Connect your input DataSet to the tile. You can only use one DataSet as input.
-
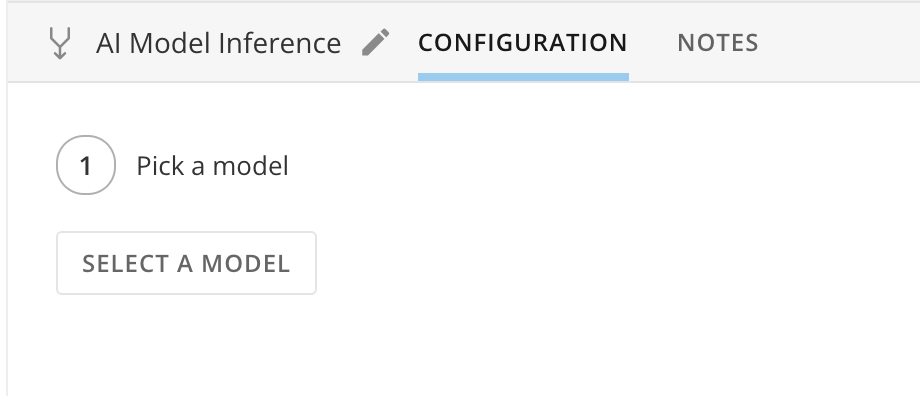
In the tile editor, choose Select a Model to search for and choose a model to use for your inference. The model schema must match the schema of the input DataSet. If the schemas do not match, an error message displays.
If the schema of your input DataSet matches the model’s schema, you can select the model you want to bring in. You can only use models with a CSV type in Magic ETL.
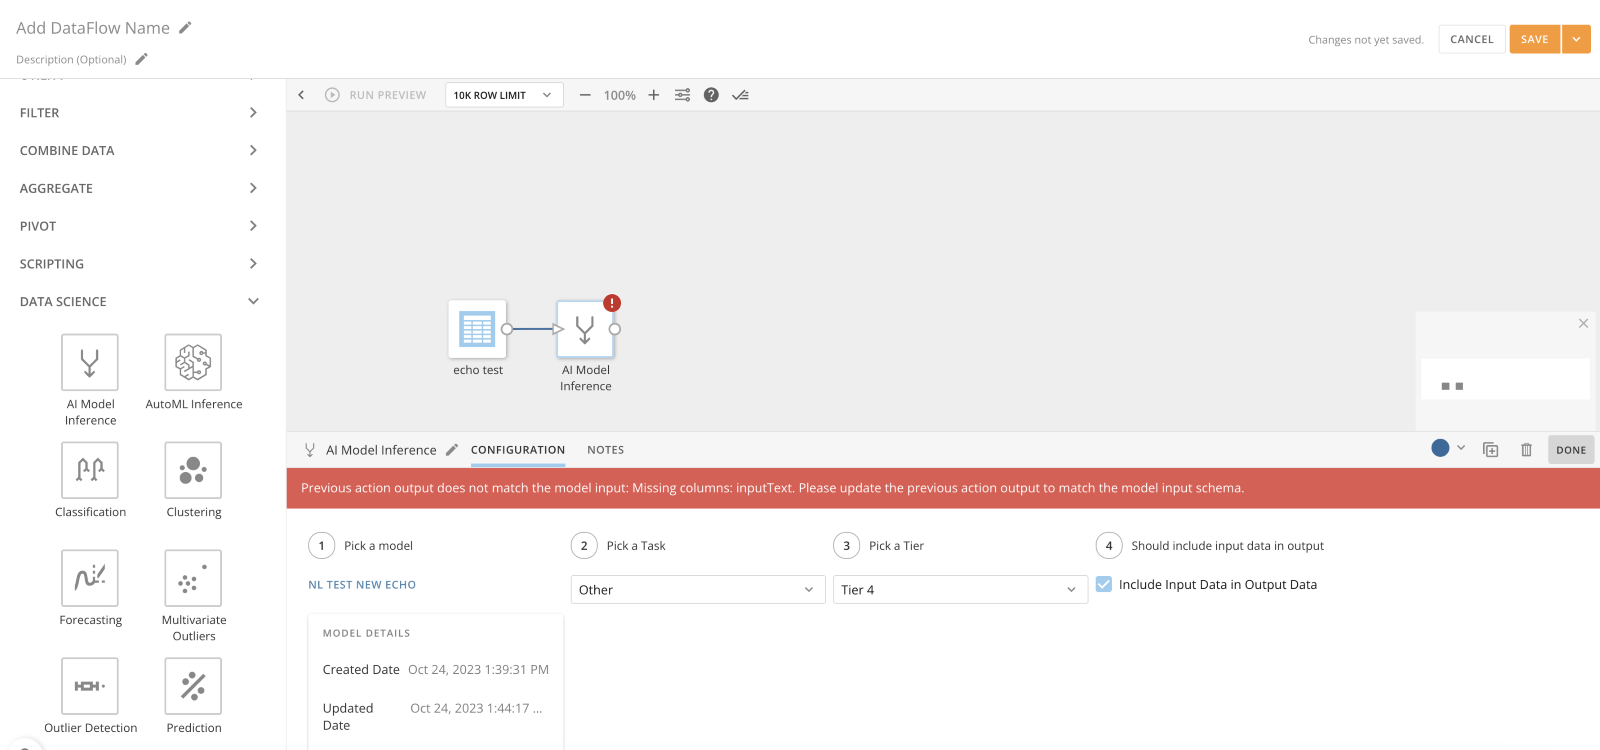
- Depending on the model, you can select a task if multiple options are available in the Pick a Task dropdown. The model task automatically generates from your selected model. Models may have multiple tasks, but only one task is selected for the DataFlow. In the example used above, only the “Other” task type is available.
- Select a tier, depending on the number of resources used to run the model. A tieris the size of the resources the model is running with and the number of central processing units (CPUs) used. Learn more about compute tiers.
-
(Optional) Check the box labeled Include Input Data in Output Data to duplicate all the rows from your input DataSet. This means that if you have 10 rows of data in your input, there will be 10 rows of data in your output.
If you leave the box unchecked, only the inferred data is included in the output DataSet.
Text Generation Tile

Required Grants
To access the Text Generation tile in Magic ETL, the following grants must be enabled for your role:- Execute AutoML
- Create AI Service Models
- Use AI Services
Configure the Text Generation Tile
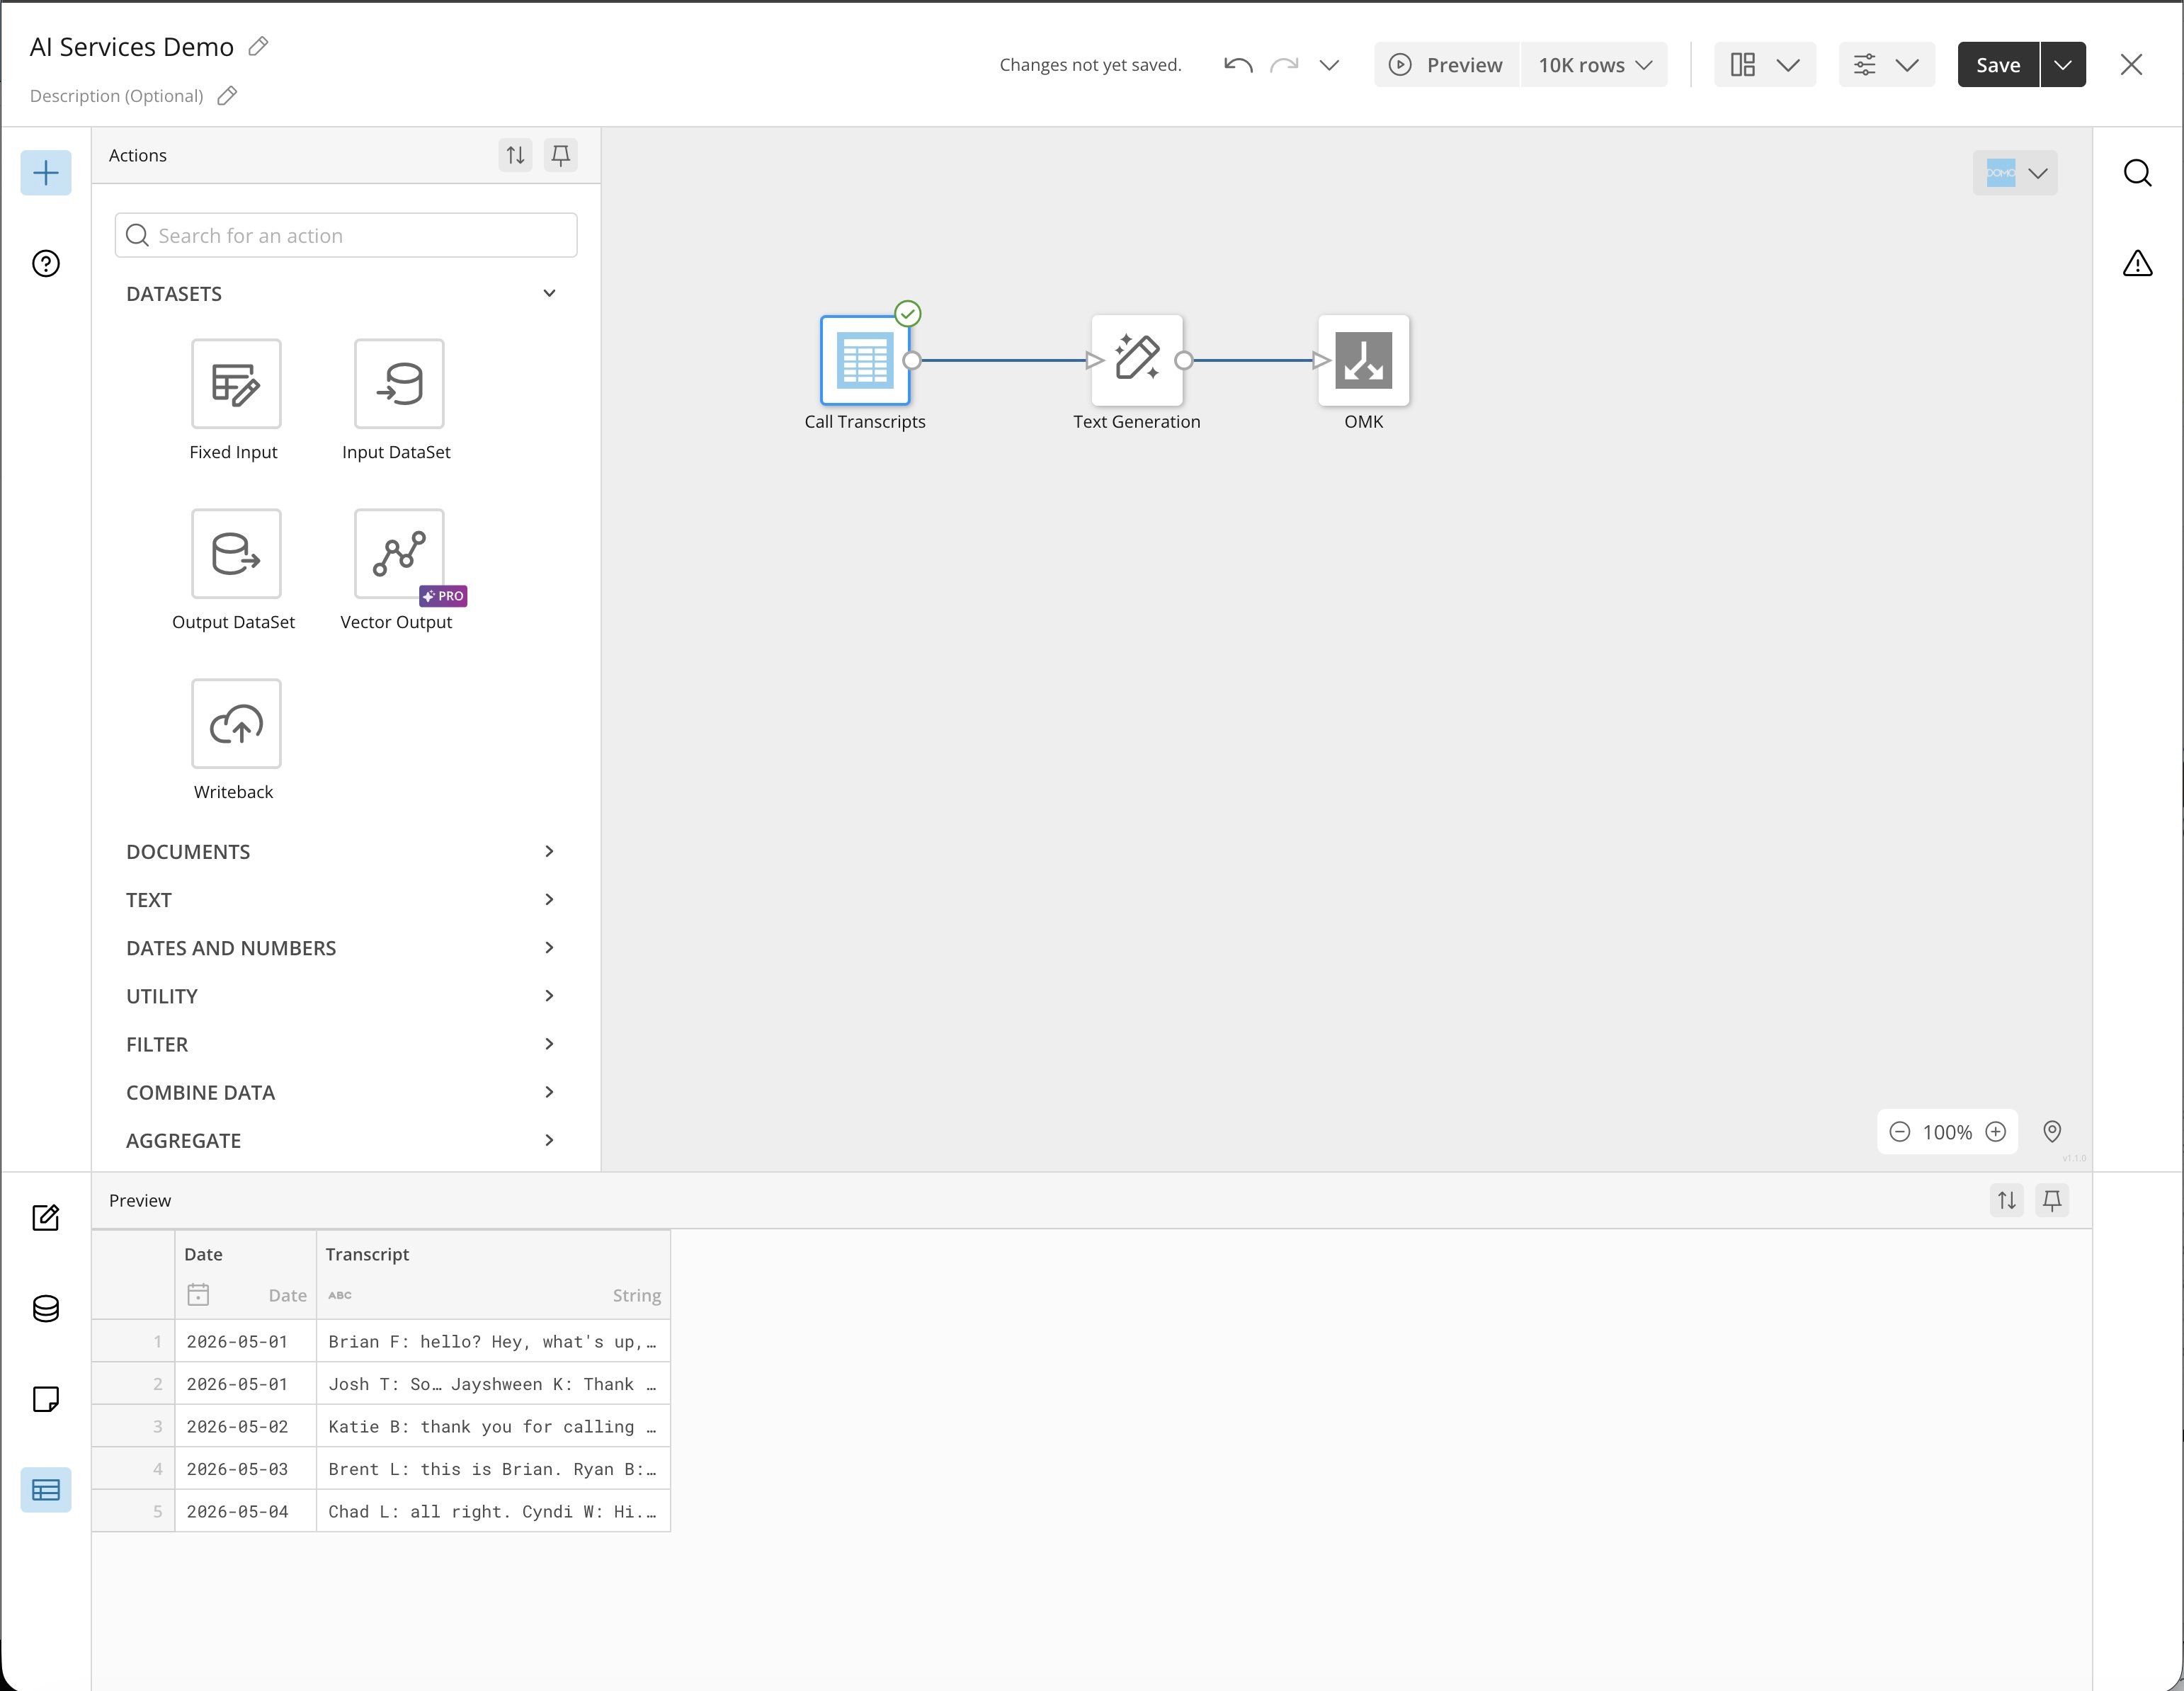
- Open the Magic ETL canvas and choose an input DataSet that contains a text column you want to analyze.
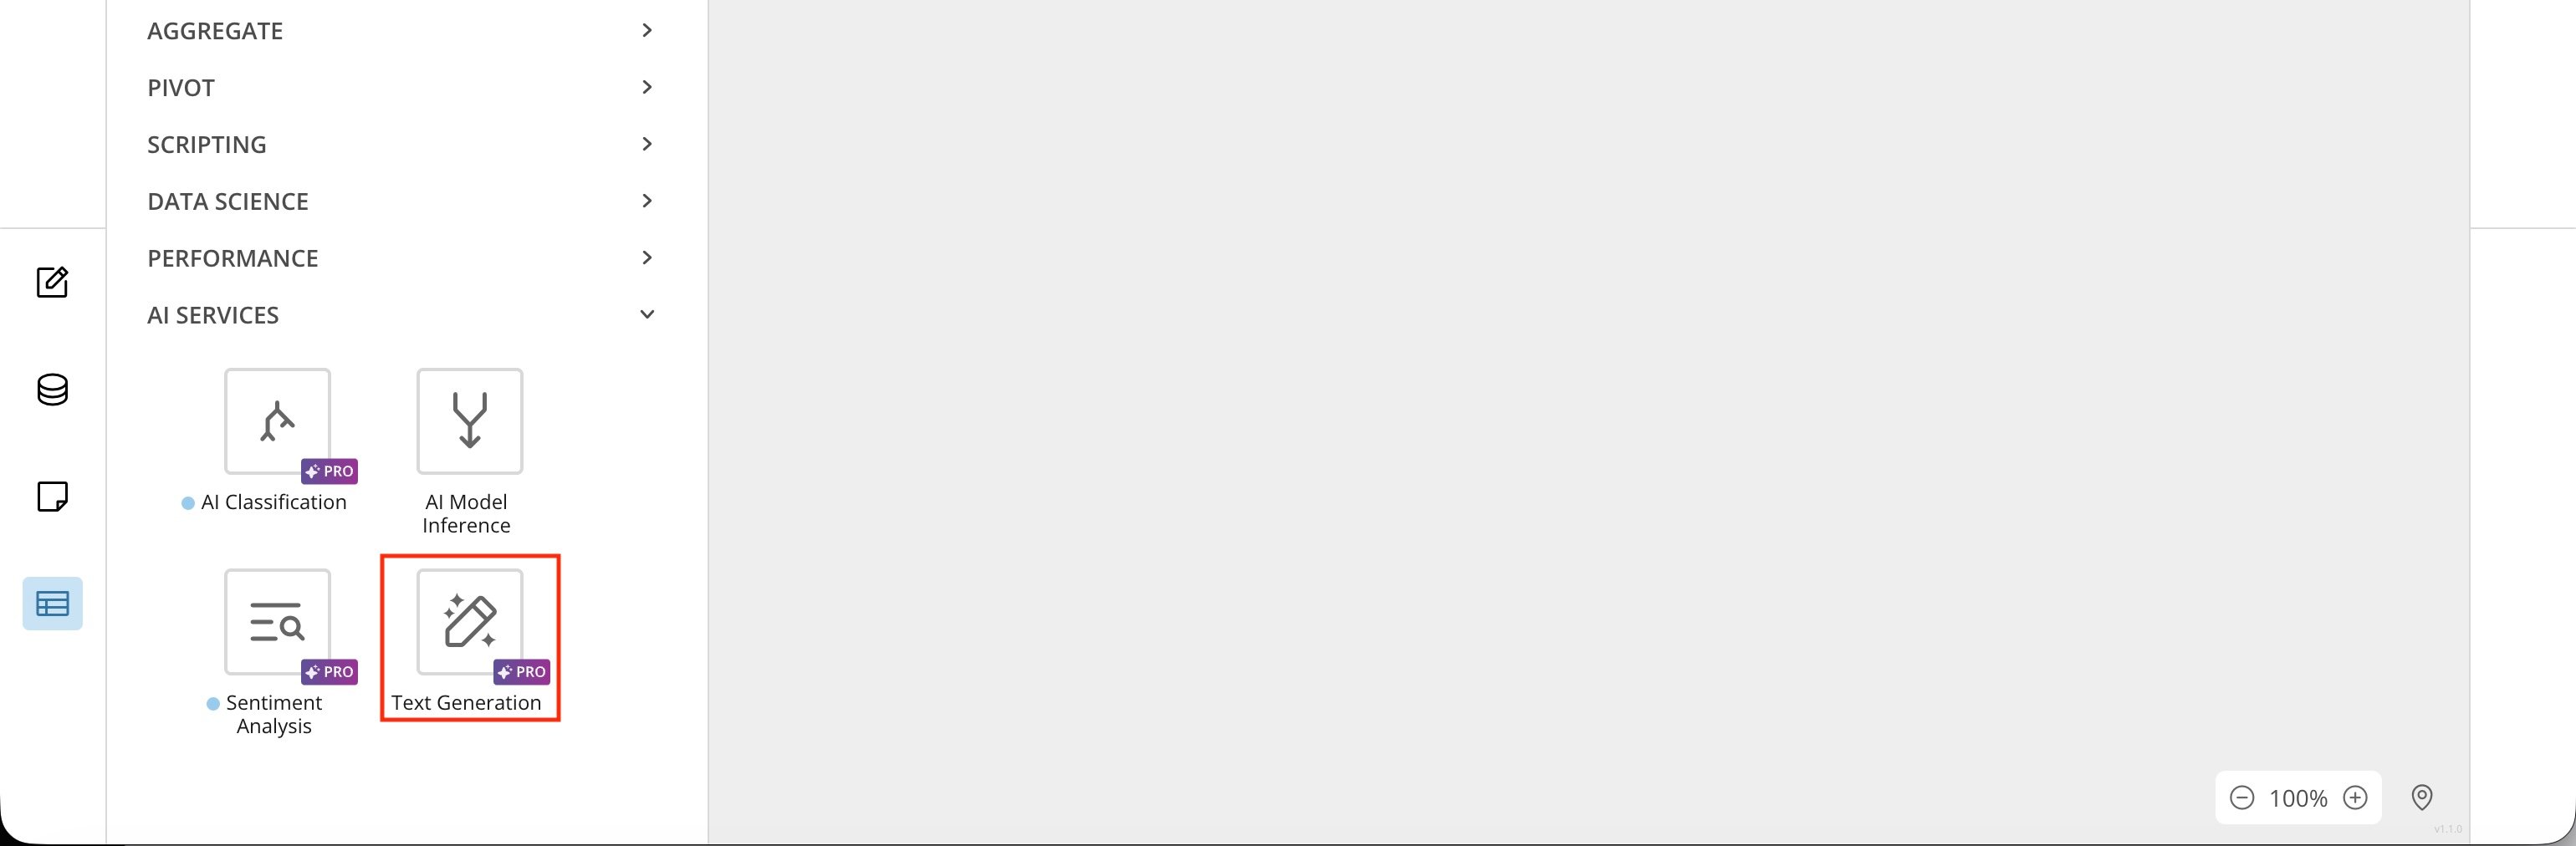
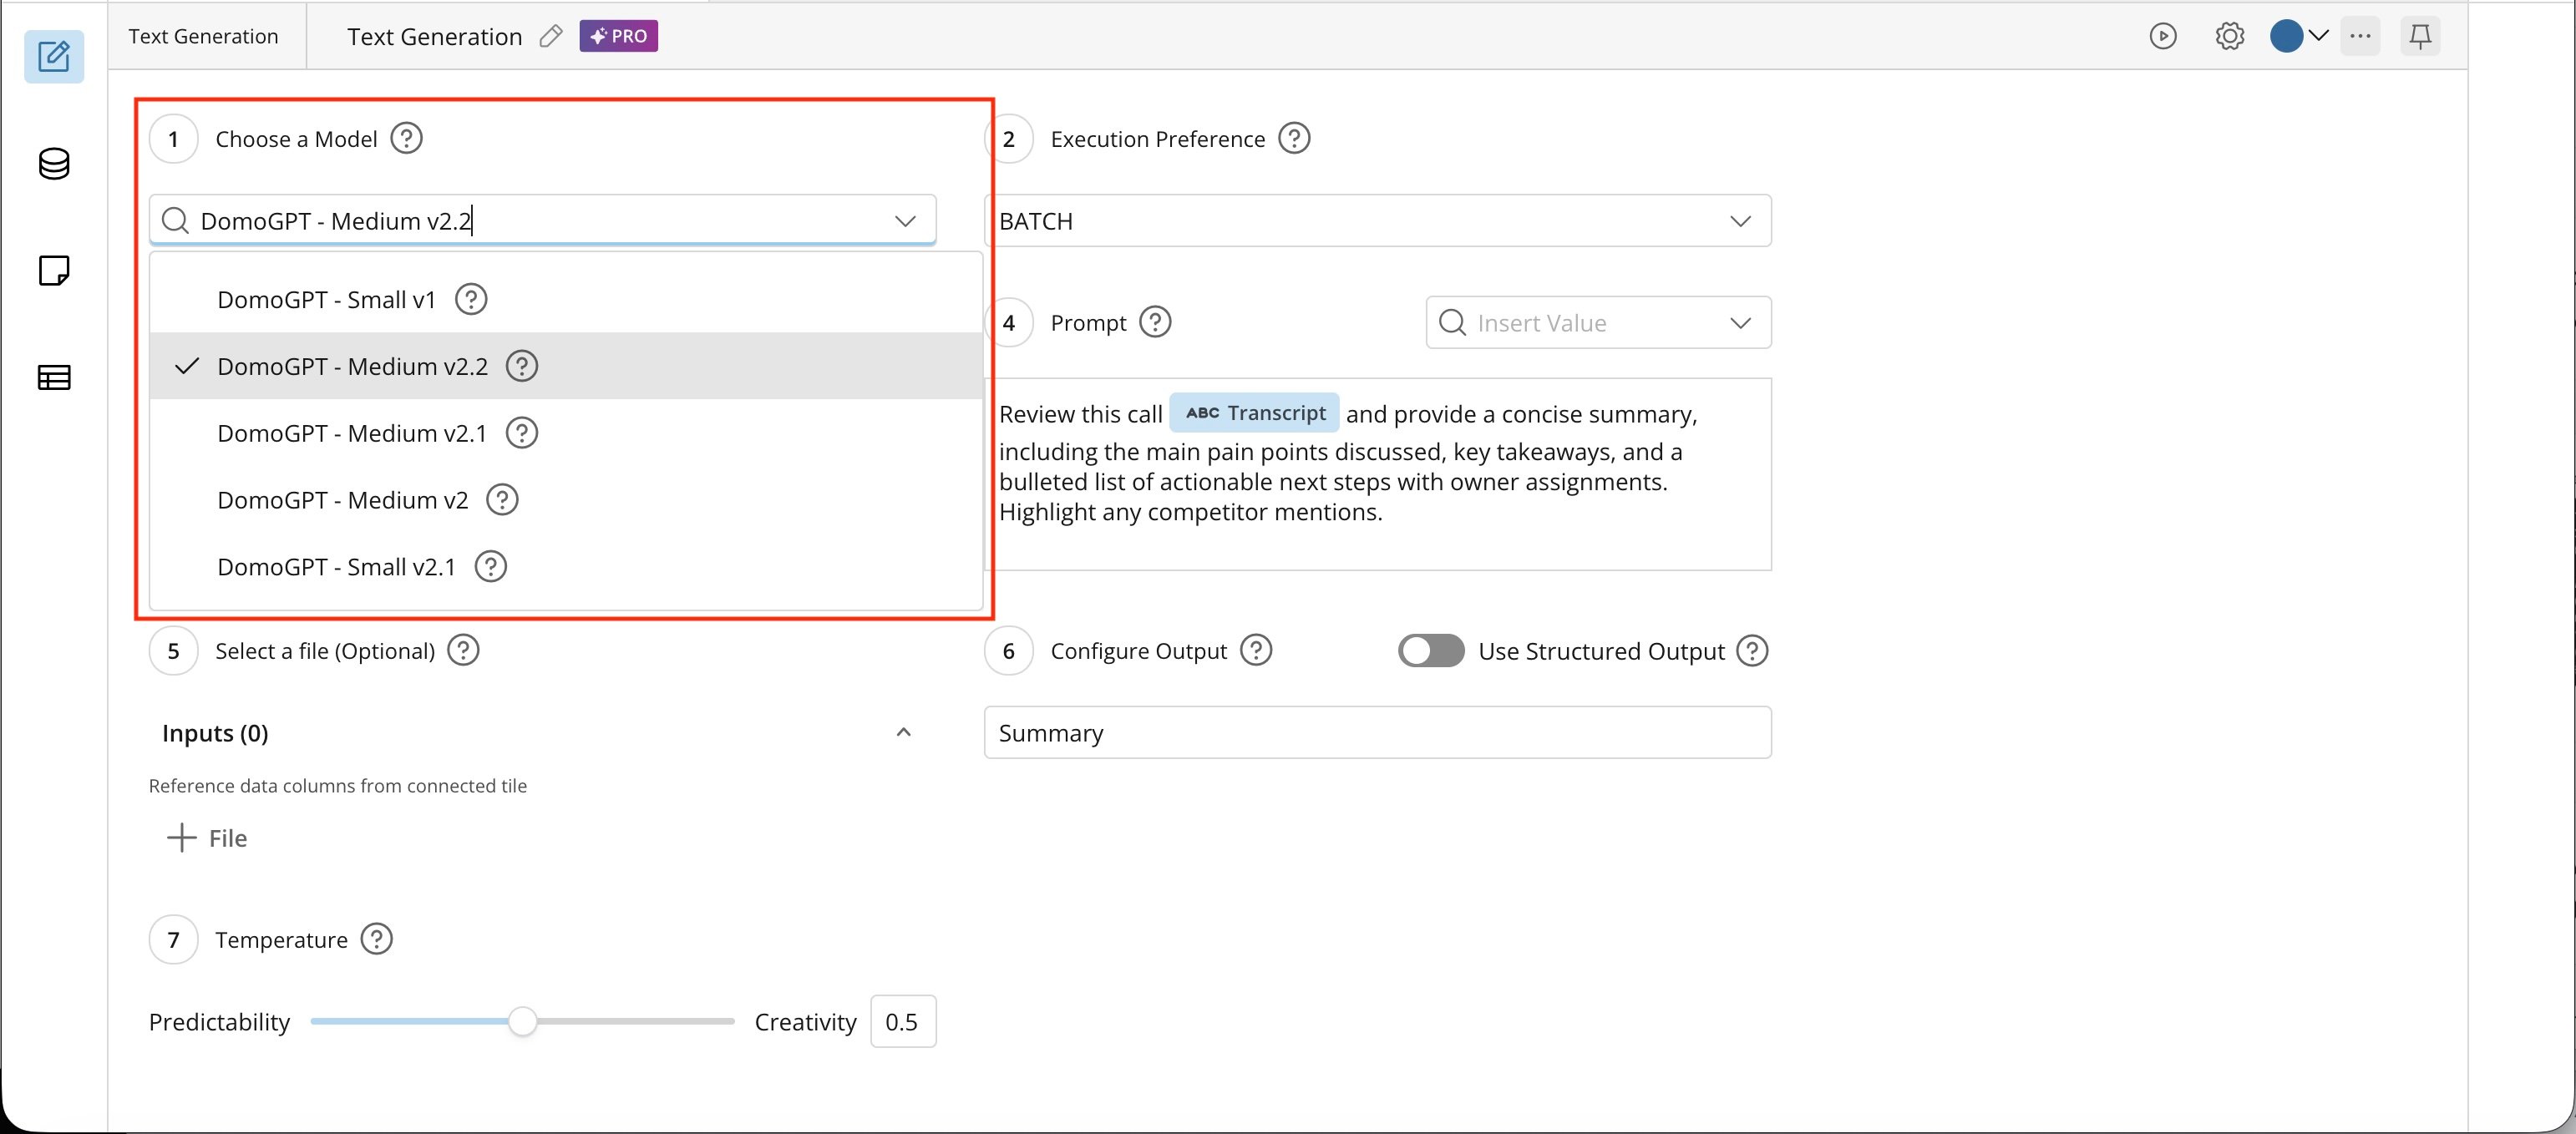
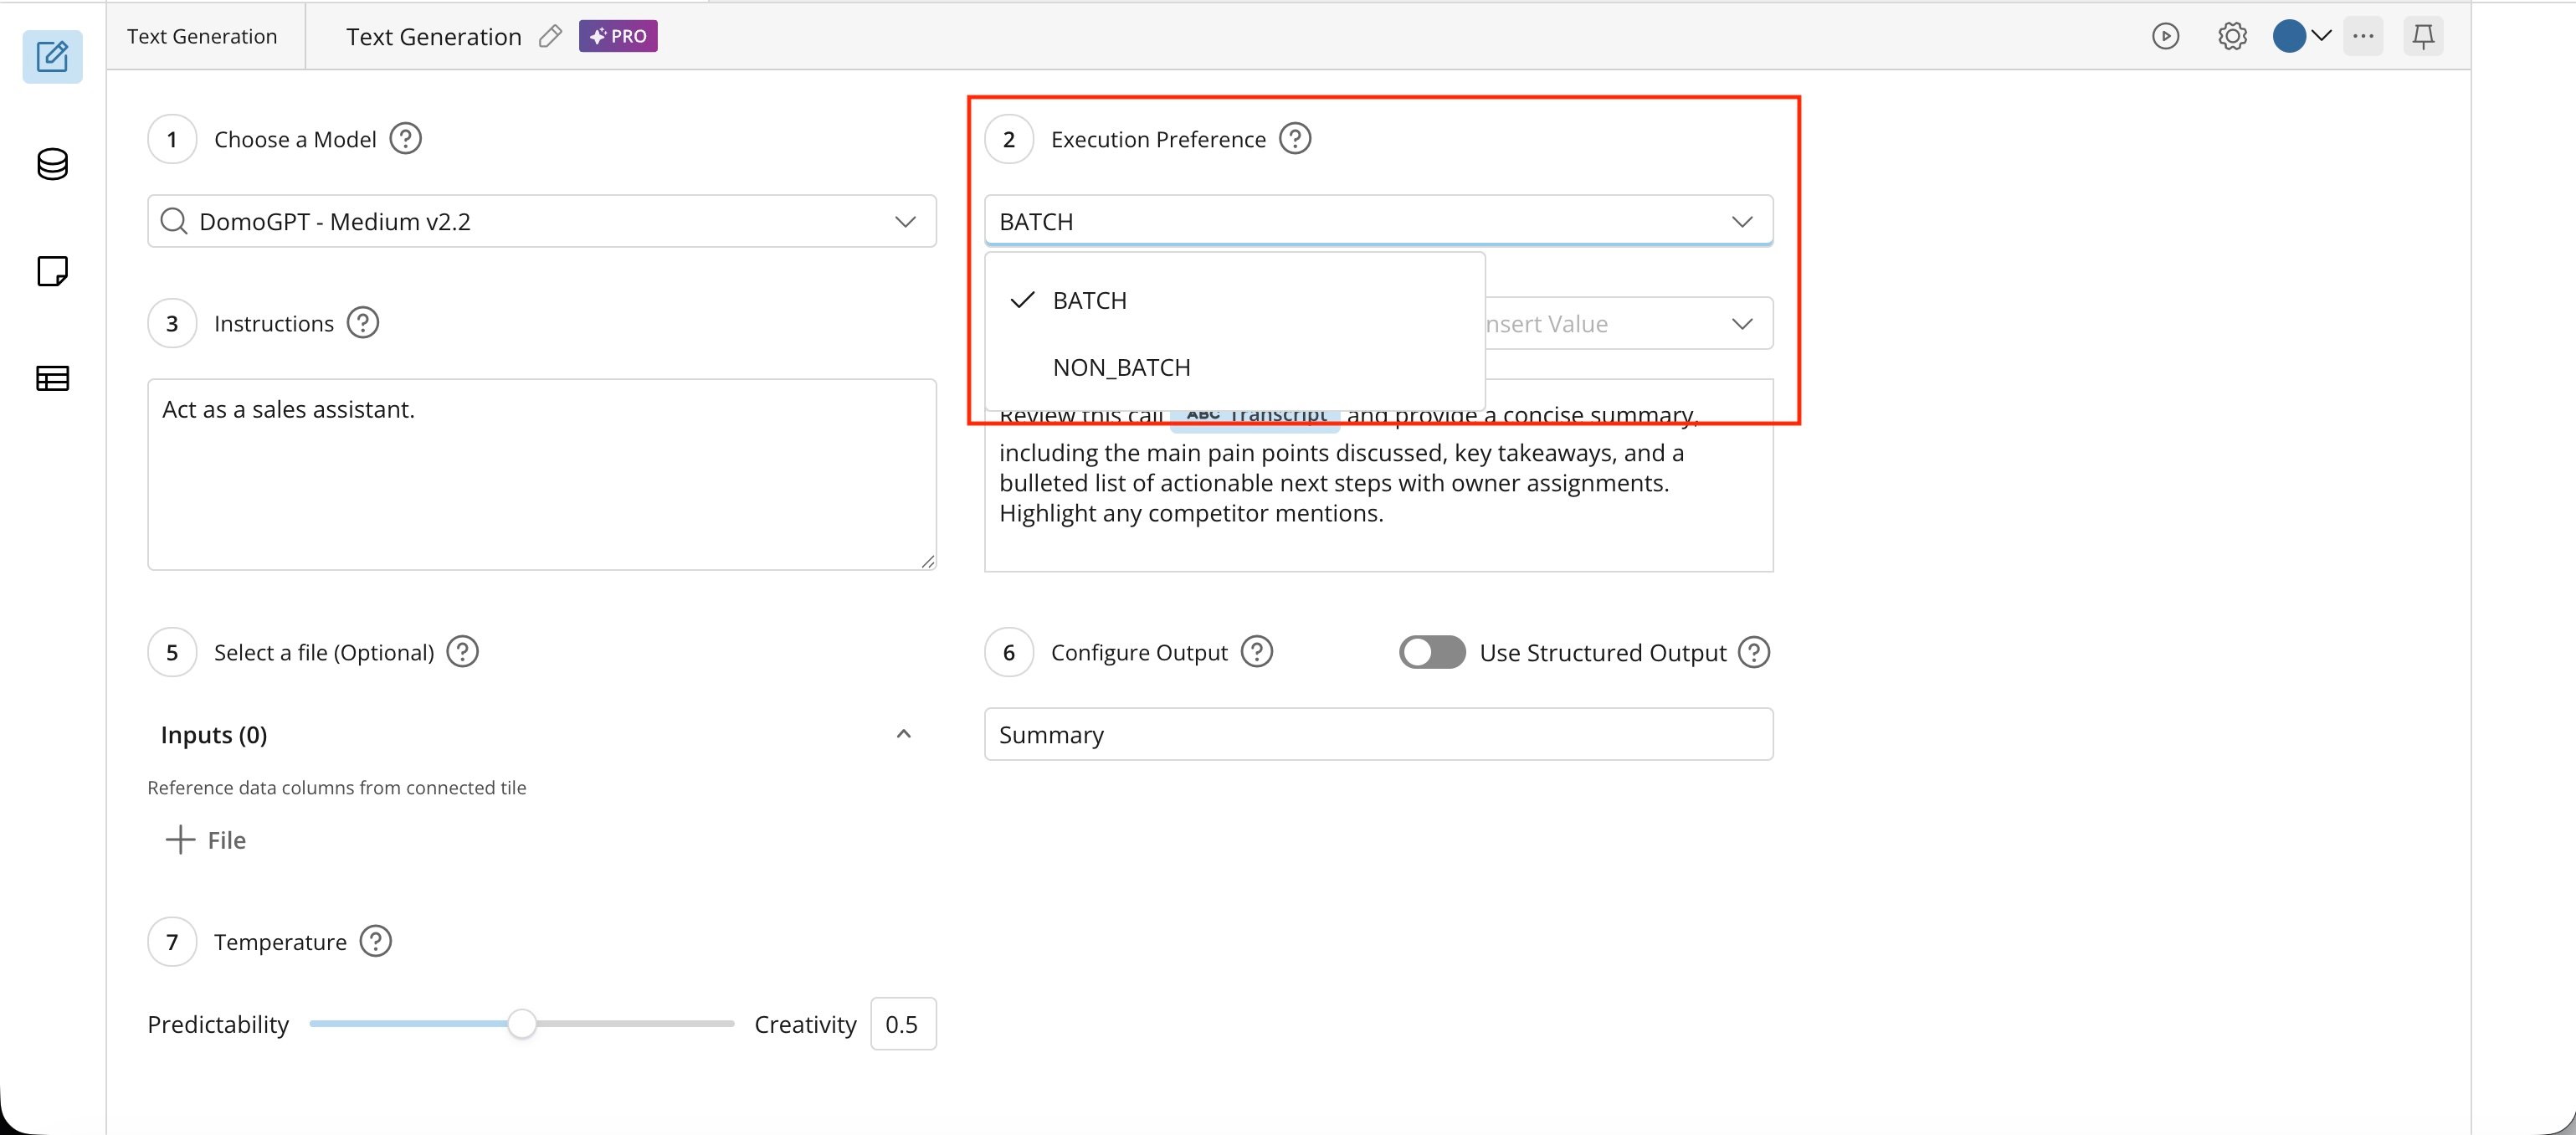
Note: Batch and non-batch processing differ primarily in latency, cost, and use case.Batch processing is designed for high-volume, asynchronous workloads, so execution times vary. It’s generally more cost-effective.Non-batch processing is intended for more consistent execution times with a small number of rows. Non-batch is always used when processing fewer than 100 rows of data.
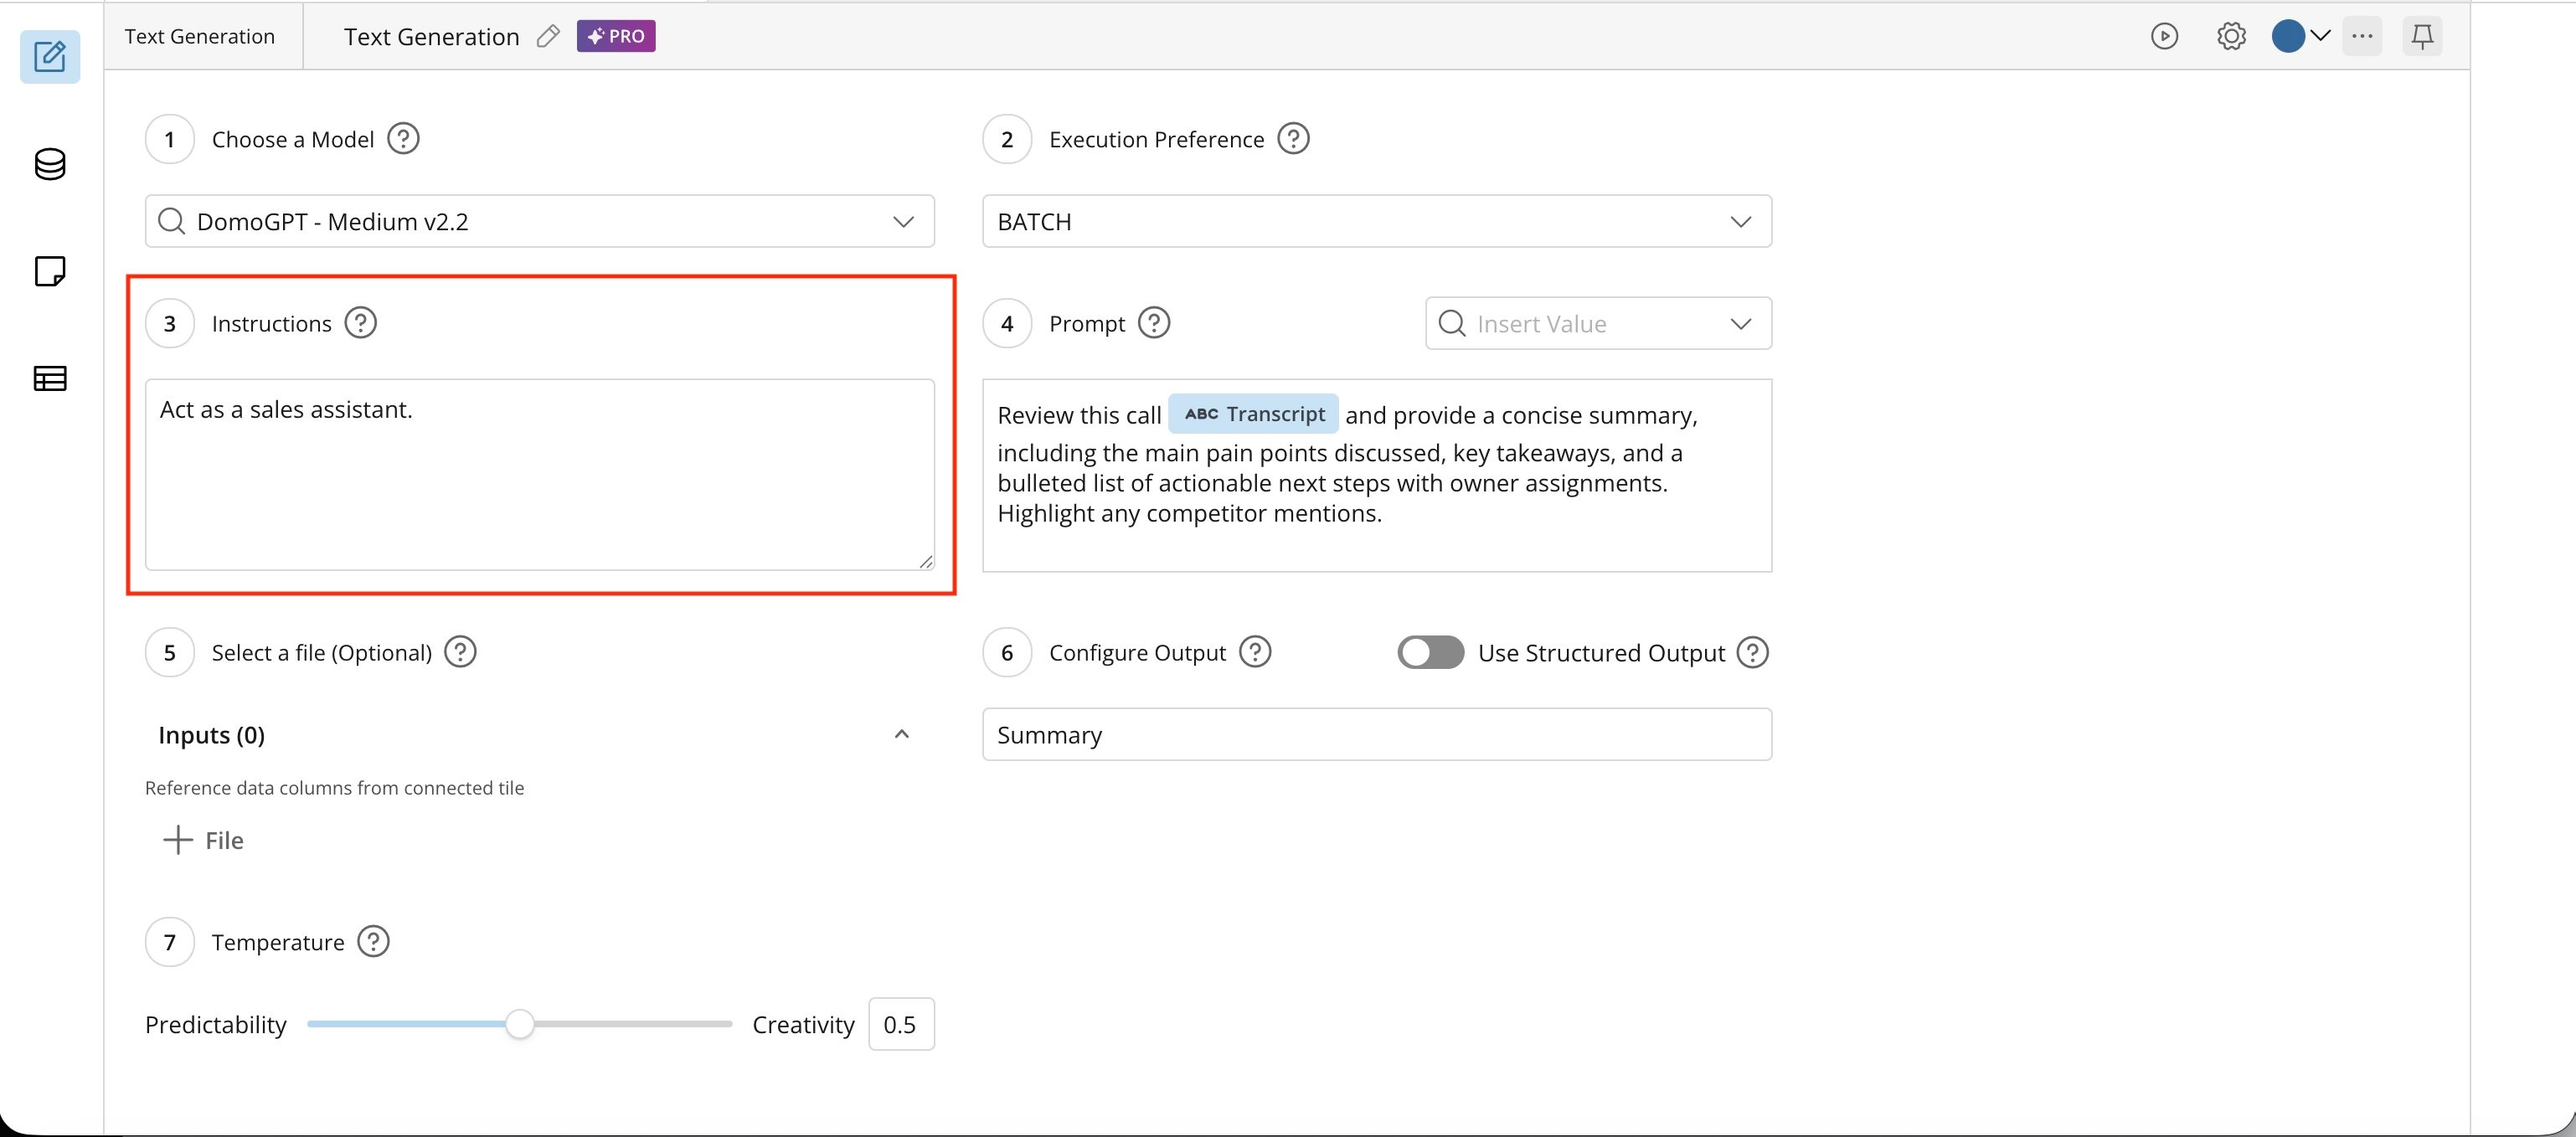
- Provide the model with instructions on how to analyze the column. Be very specific; describe exactly what you want the model to do (and not to do).
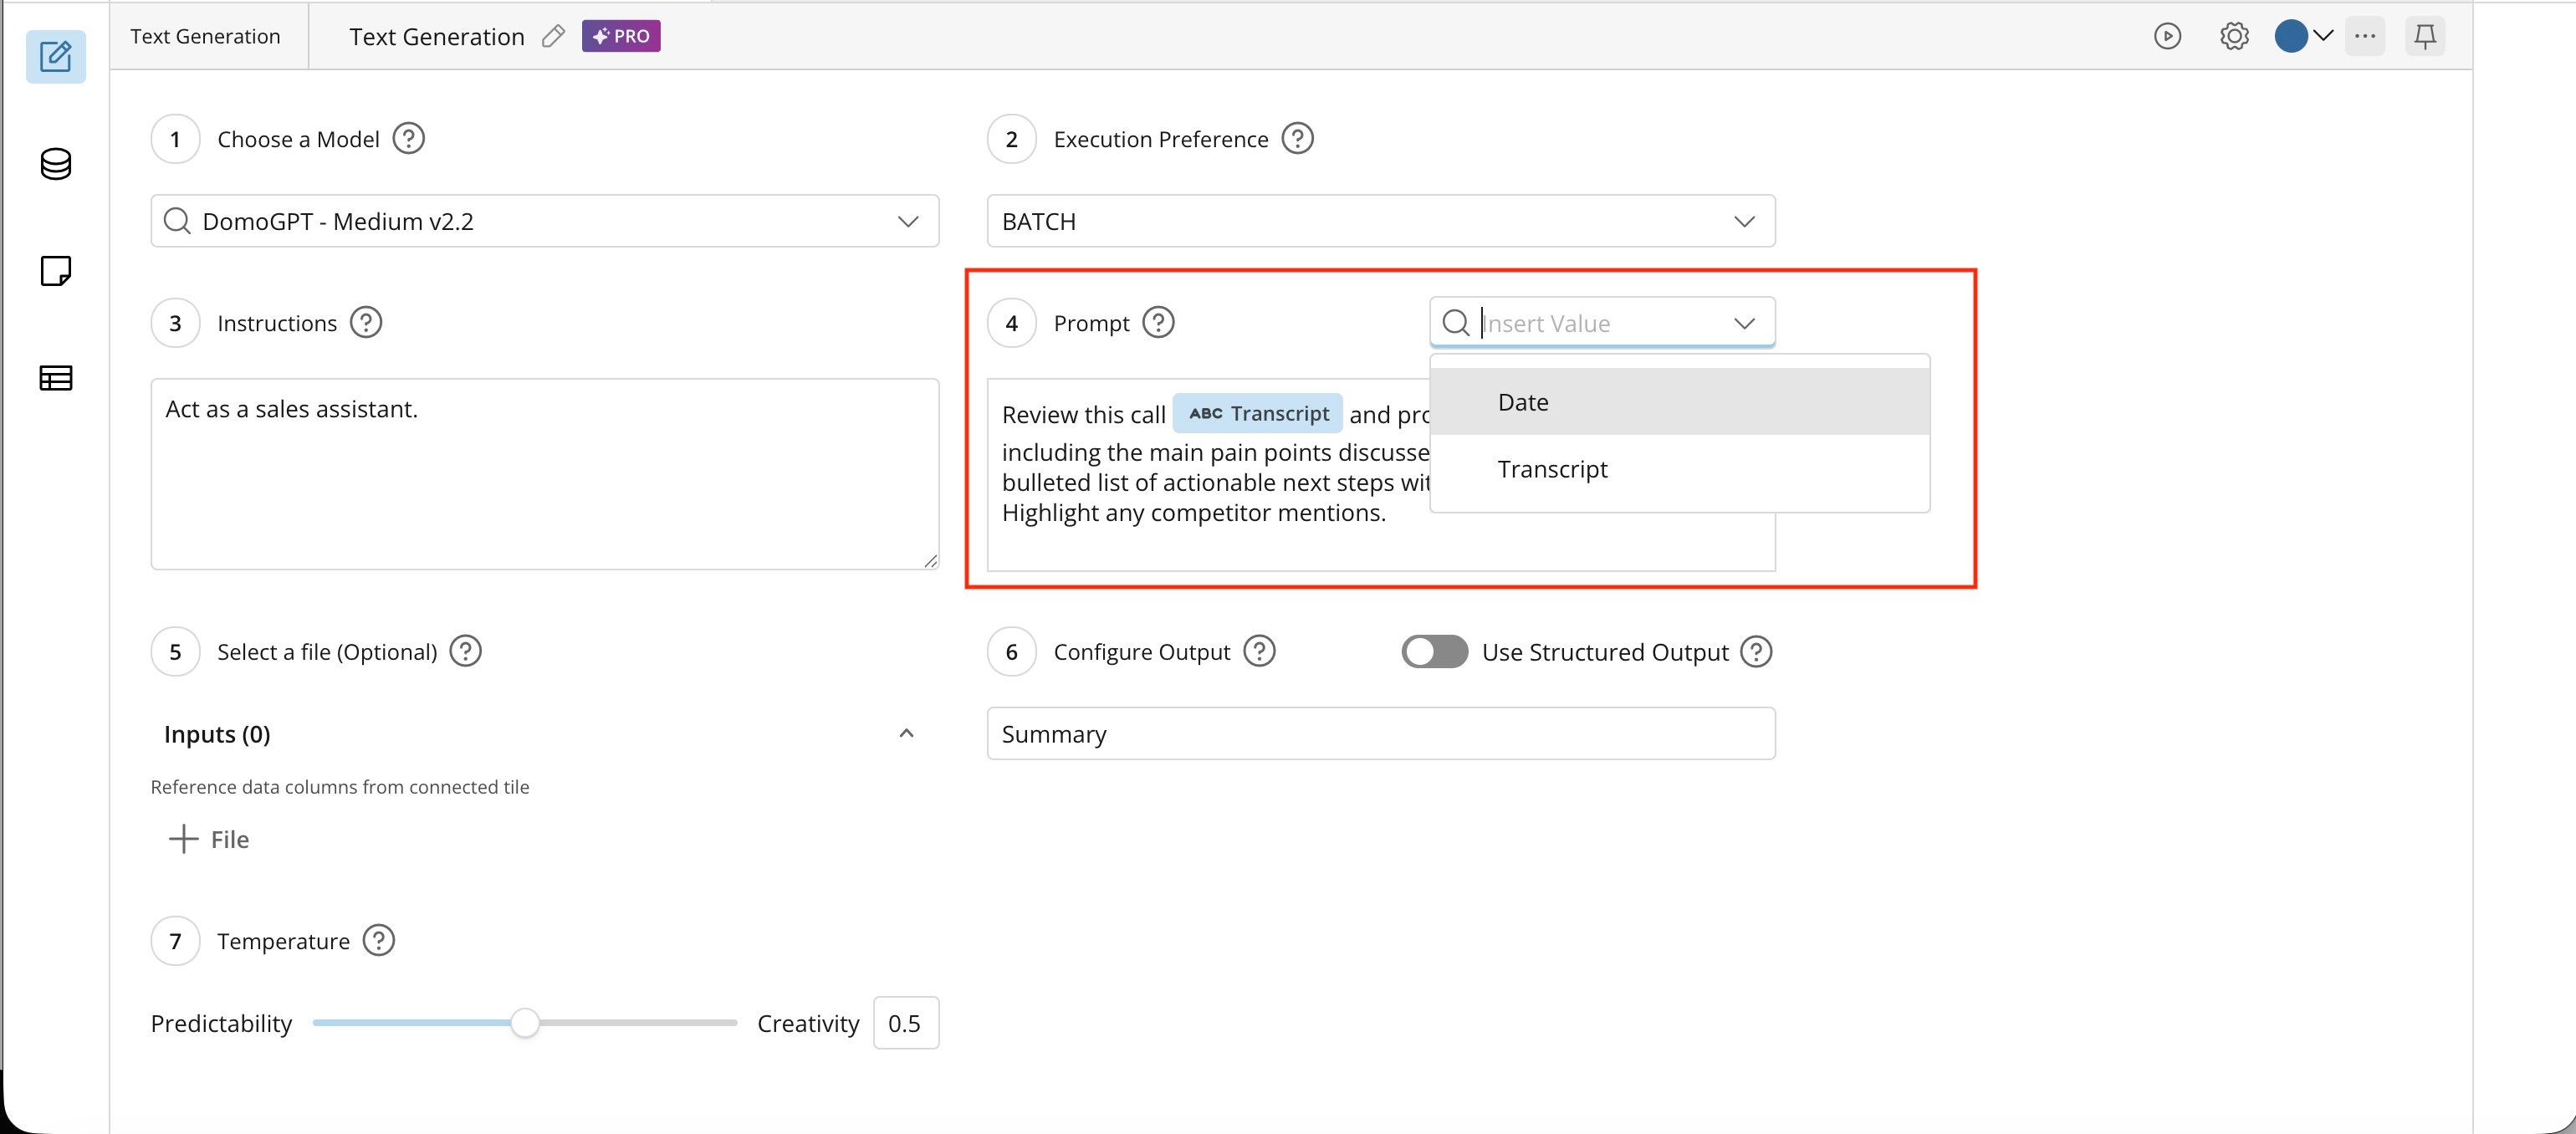
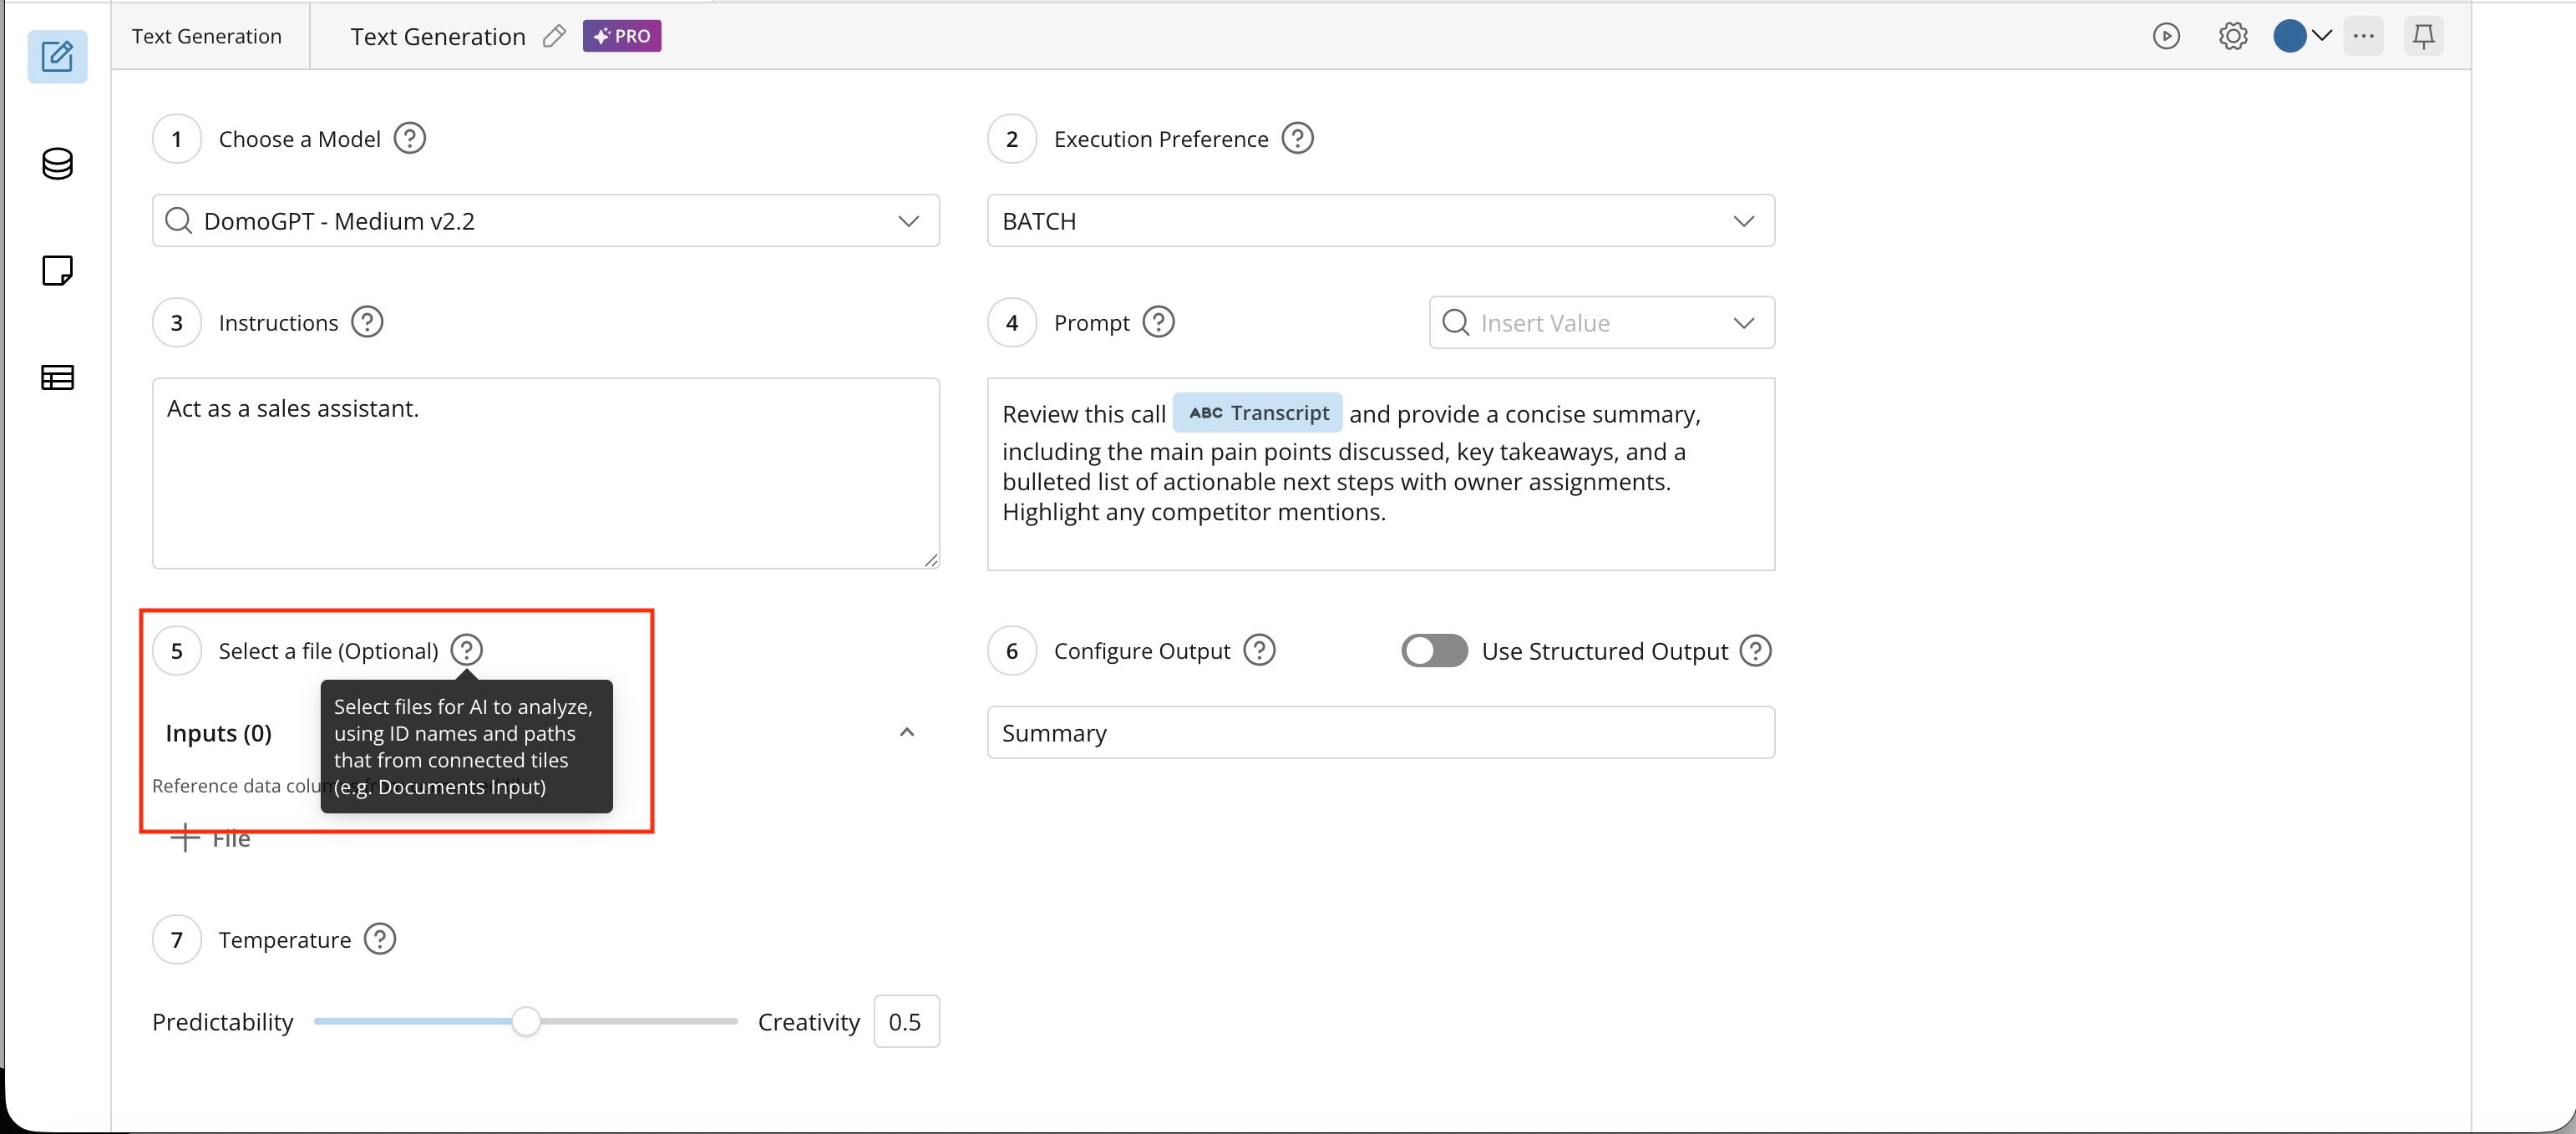
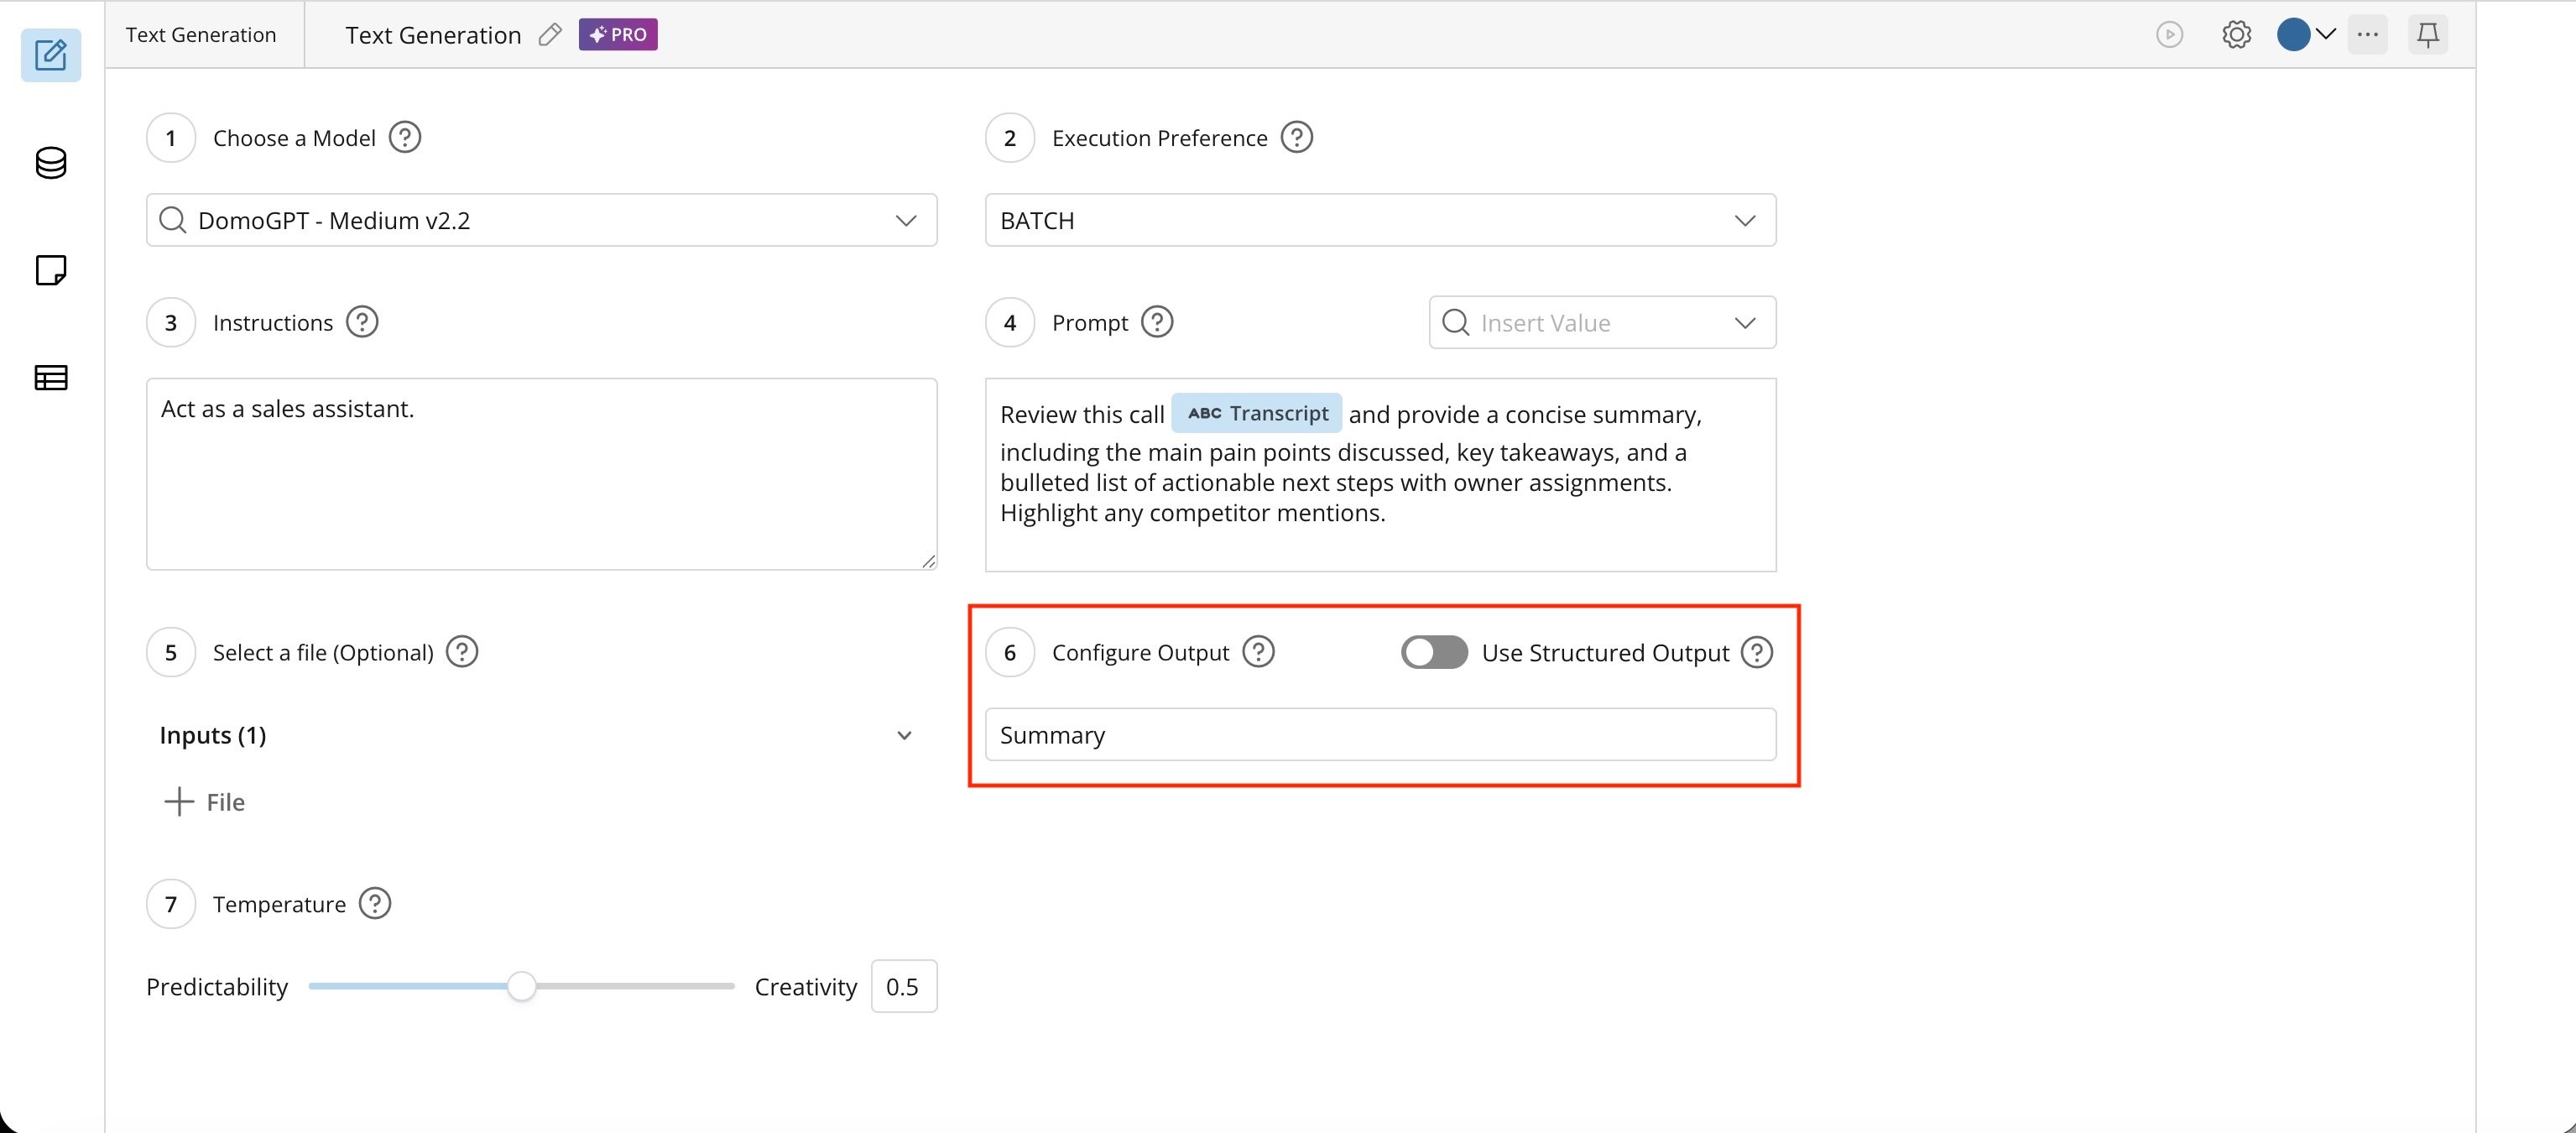
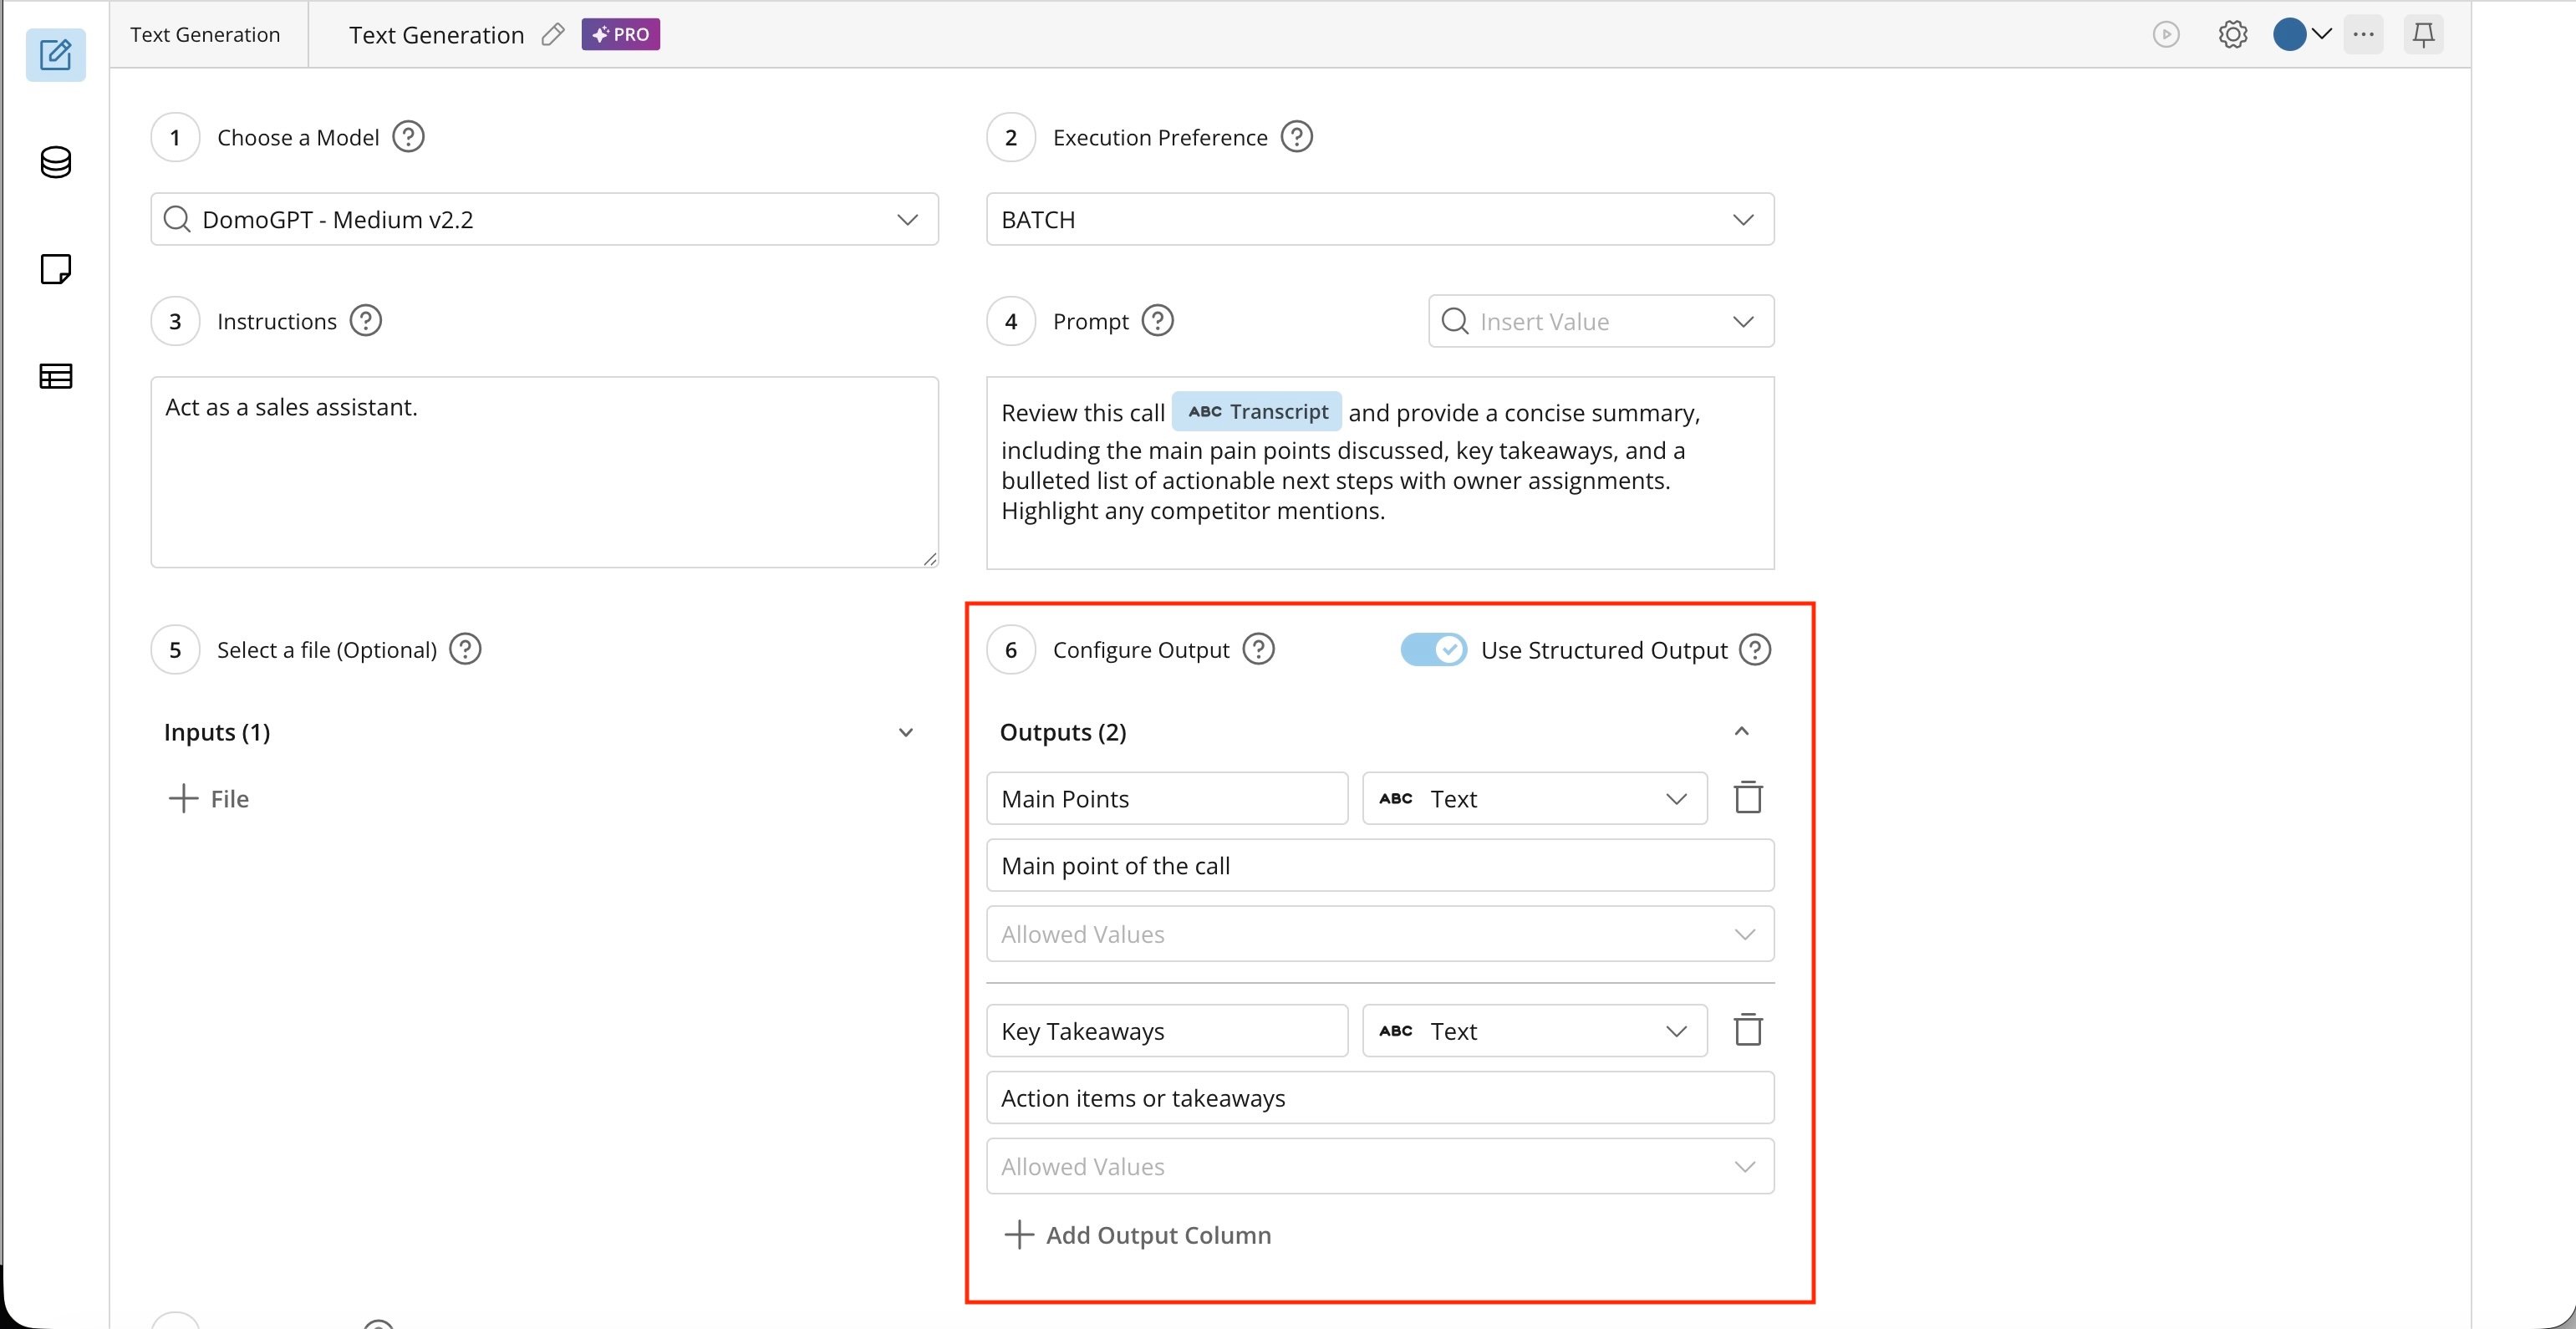
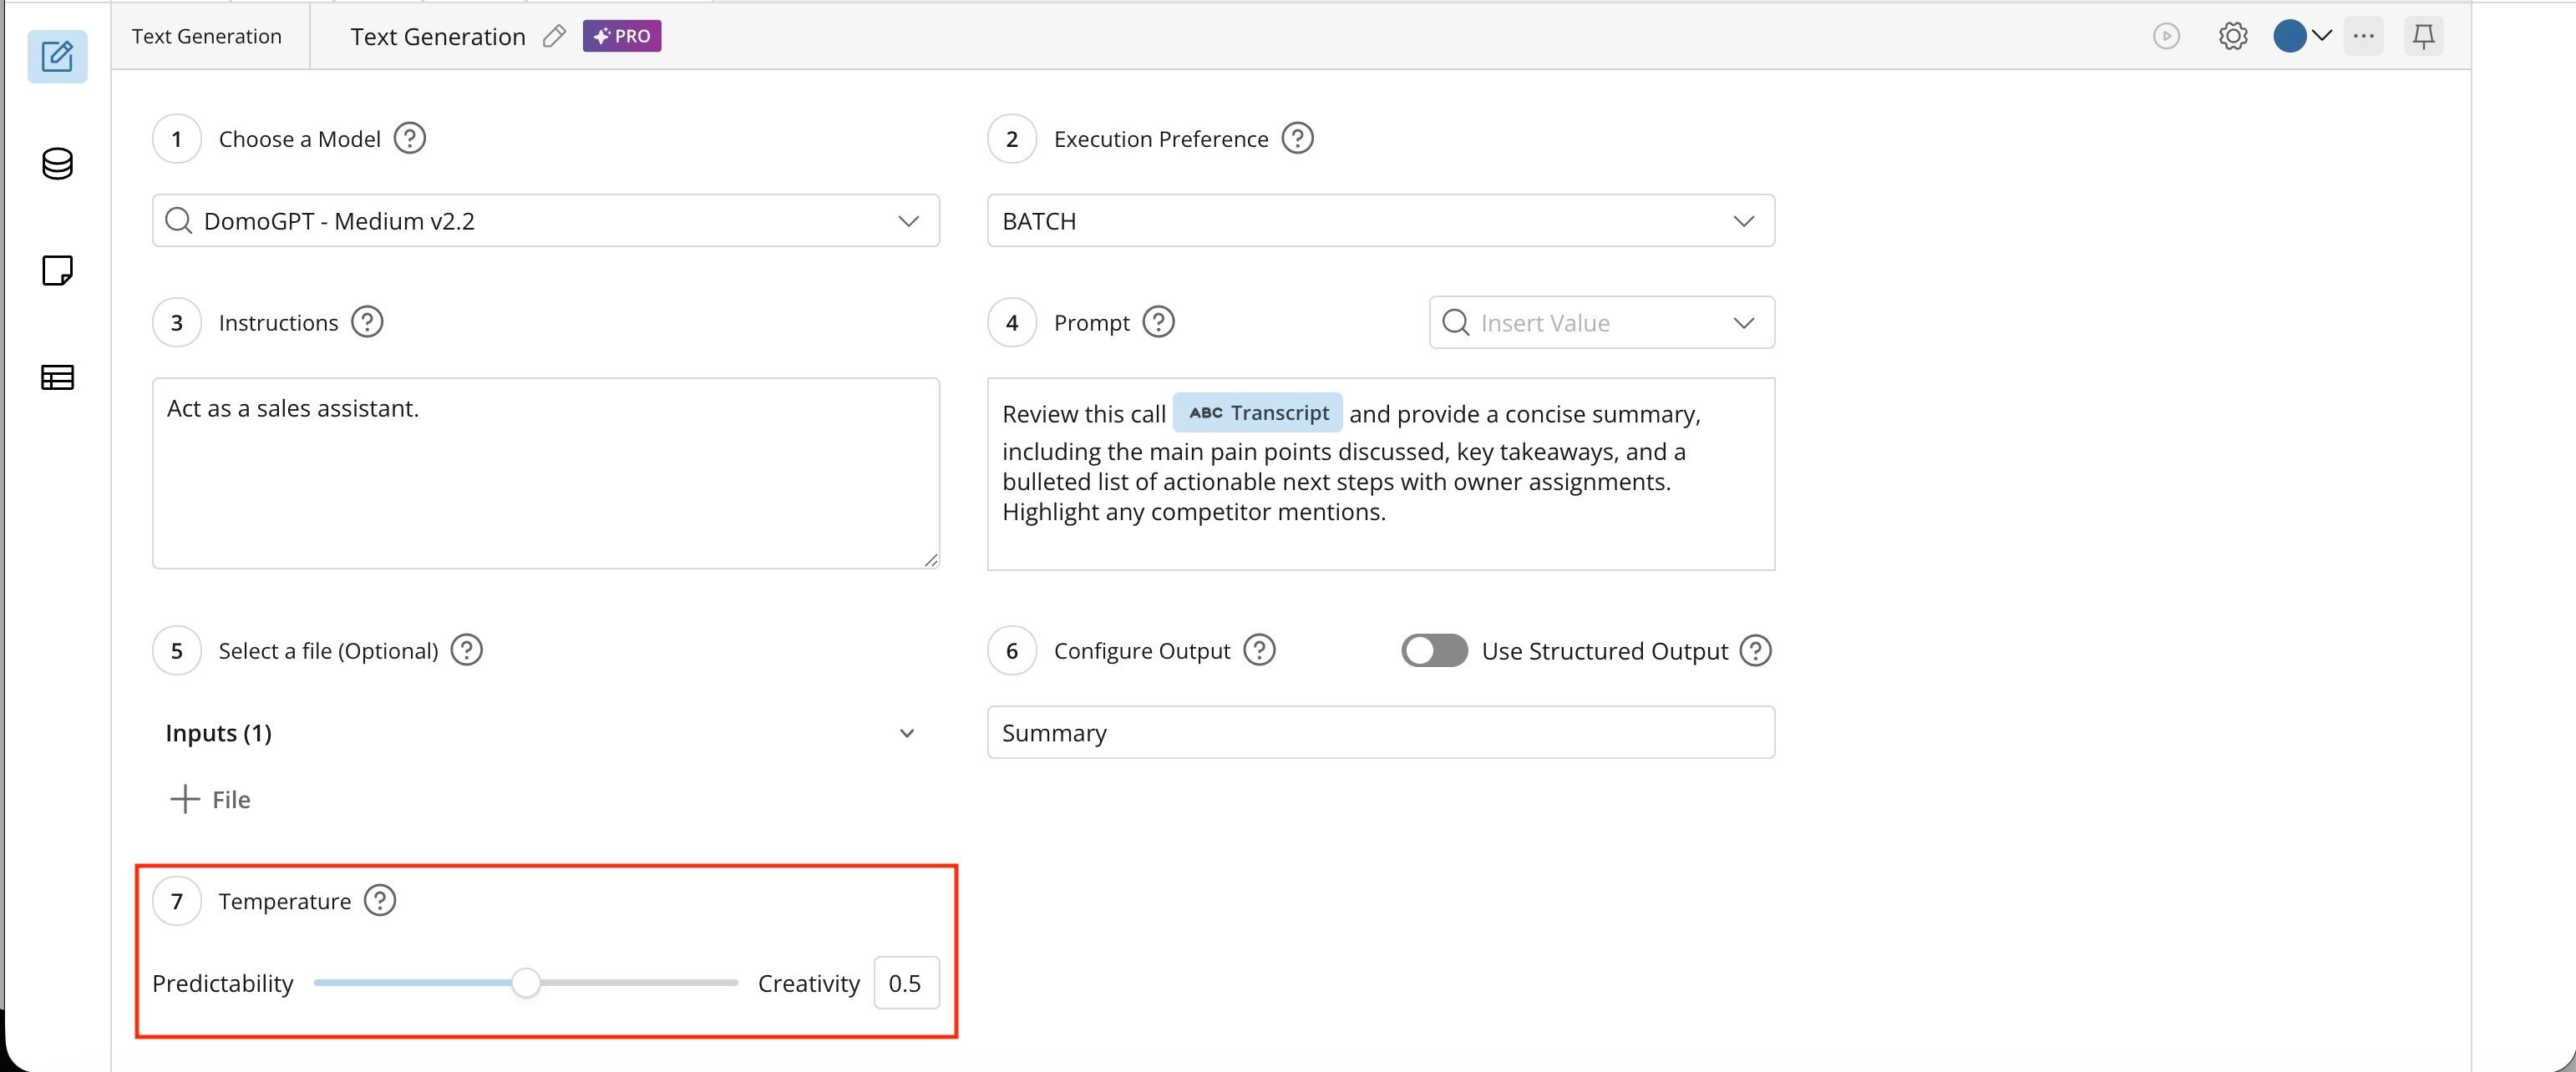
Output. You can use tiles farther downstream in the DataFlow to rename that column.
Consumption Ramifications:
- AI Operations: 1 operation per tile
- Tokens: input and output tokens vary based on the prompt and the data volume processed
- You can include multiple Text Generation tiles in the same DataFlow, tasking them with different aspects of analysis for the column (or analysis of different columns).
-
You can give multiple instructions in a single Text Generation tile, although you’ll need a way to parse the results of the multiple instructions from the single output column.
For example, you could instruct the model to separate the output of each instruction with a specific delimiter and then use the Split Columns action to parse.
Here’s an example of the output DataSet from a DataFlow leveraging multiple instances of the Text Generation tile to analyze language, translate the review to English, analyze sentiment, and categorize the review based on provided themes.

FAQ
Can I use my own model in the Text Generation tile?
Can I use my own model in the Text Generation tile?
Not currently, but this capability is on the roadmap.
Can you output multiple columns from a single Text Generation tile?
Can you output multiple columns from a single Text Generation tile?
Yes, you can enable Structure Output.
Classification Tile Beta
Required Grants
To access the Classification tile in Magic ETL, the following grants must be enabled for your role:- Execute AutoML
- Create AI Service Models
- Use AI Services
Configure the Classification Tile
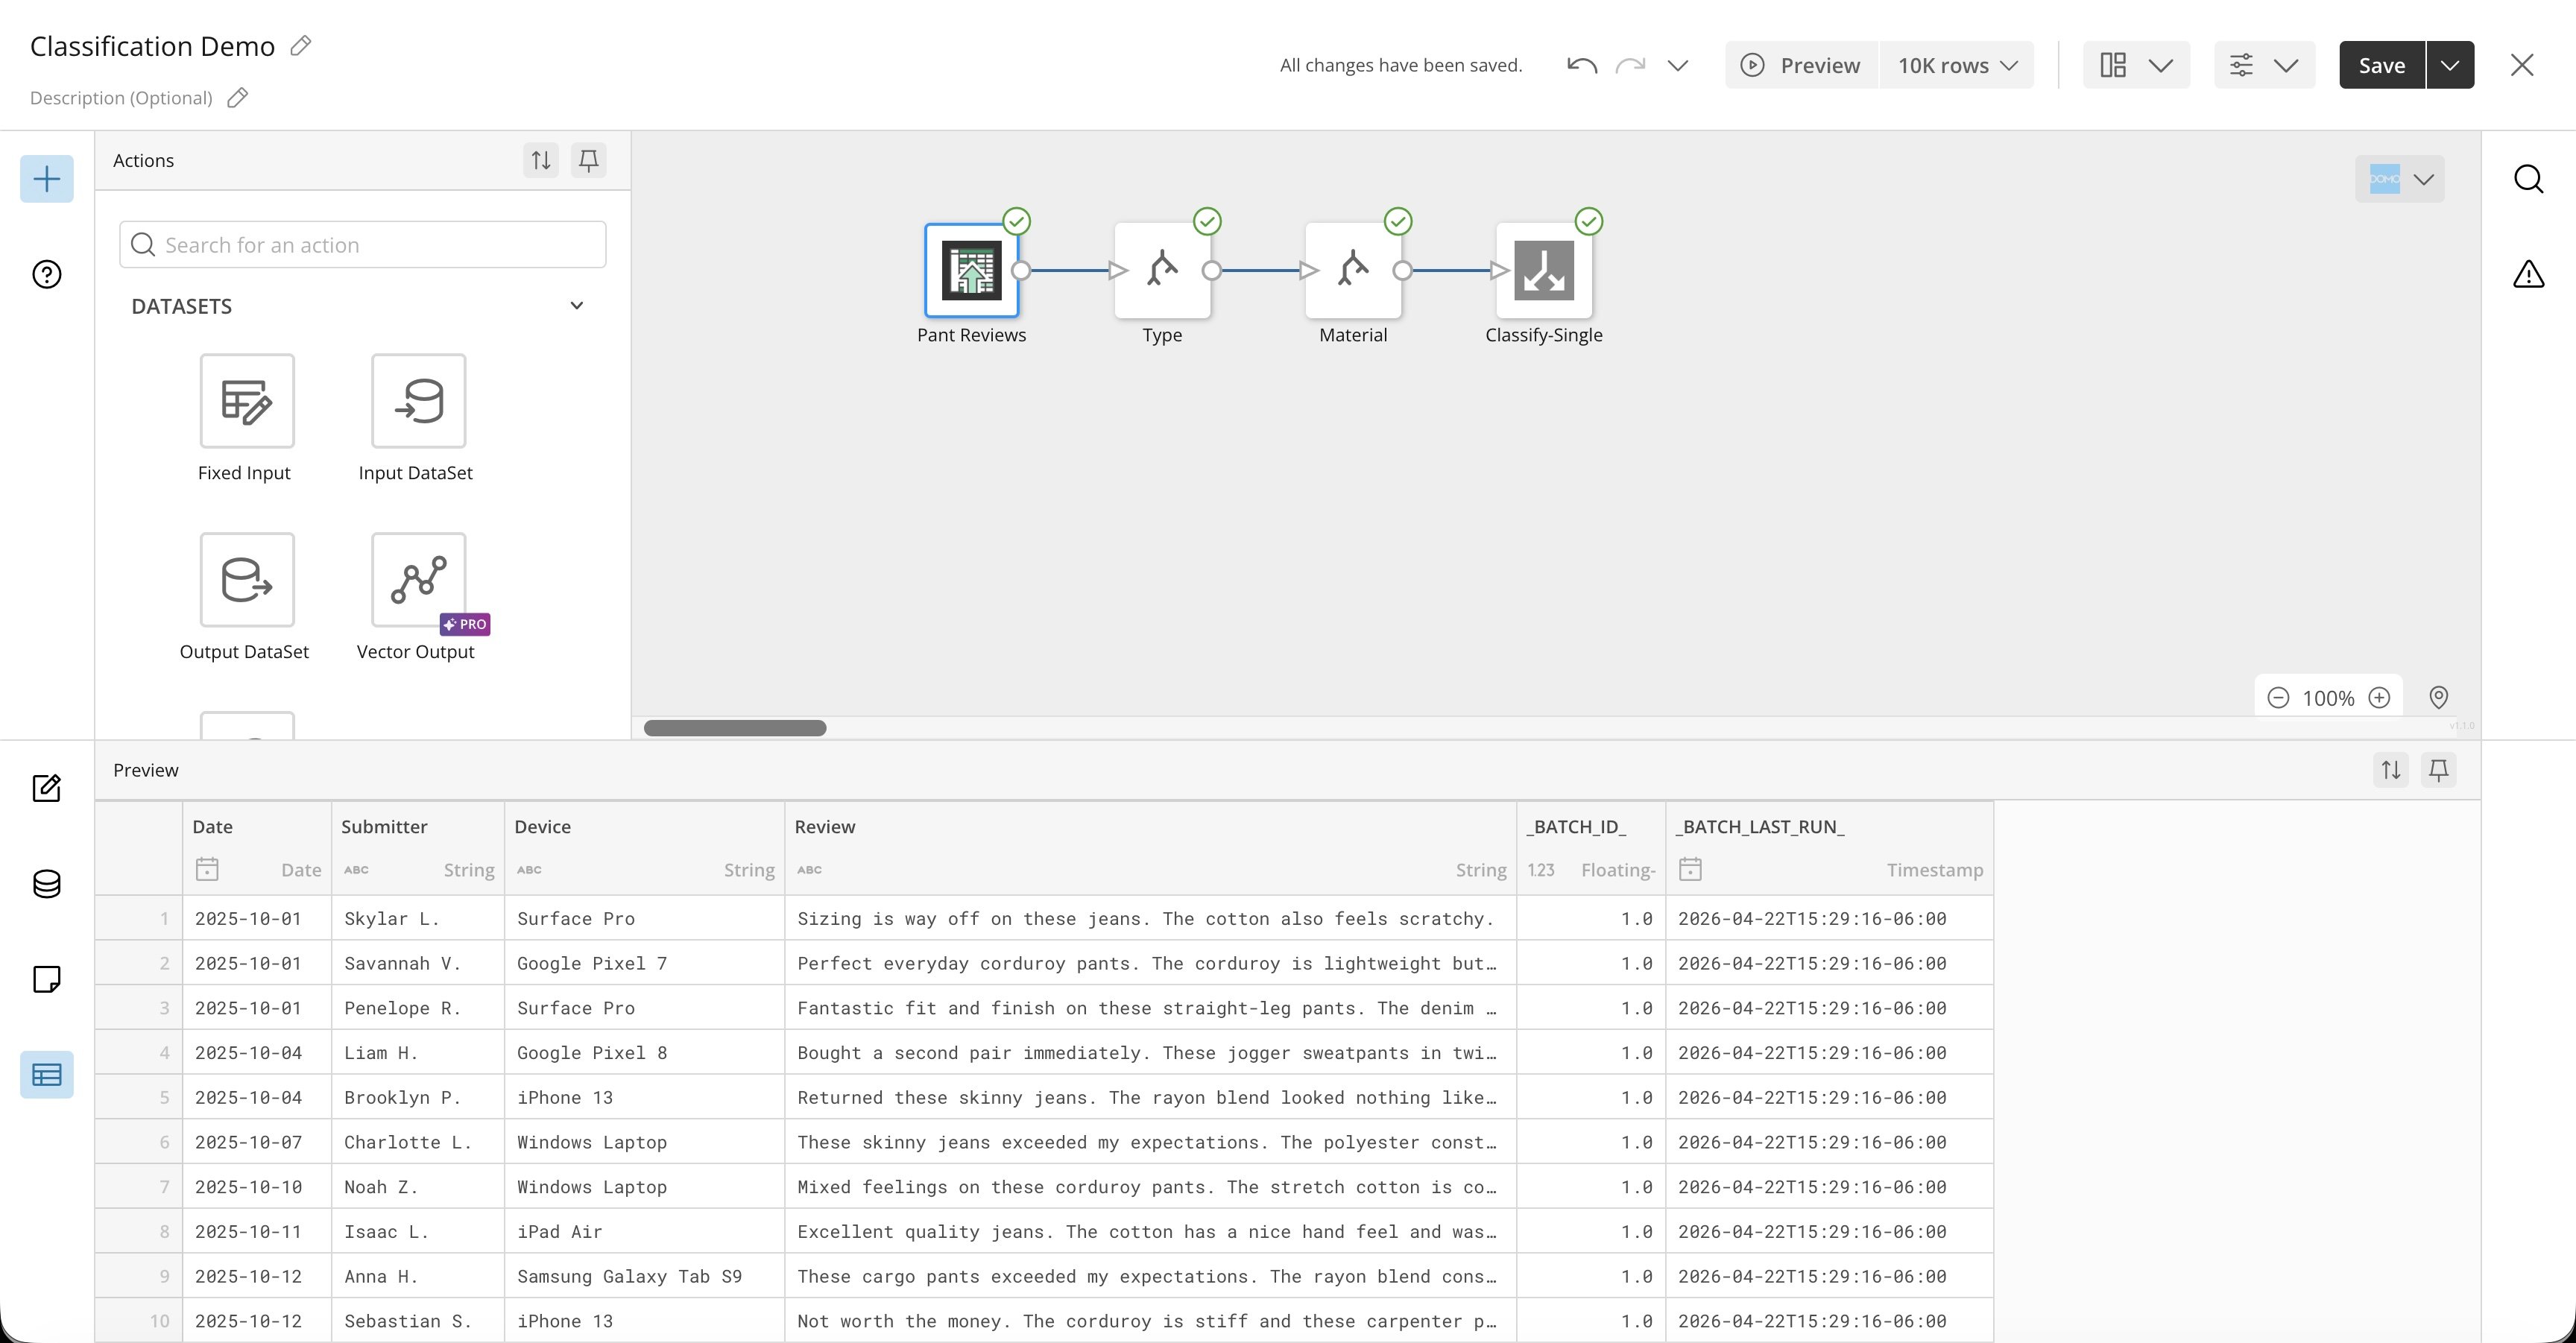
- Open the Magic ETL canvas and choose an input DataSet that contains a text column you want to analyze.
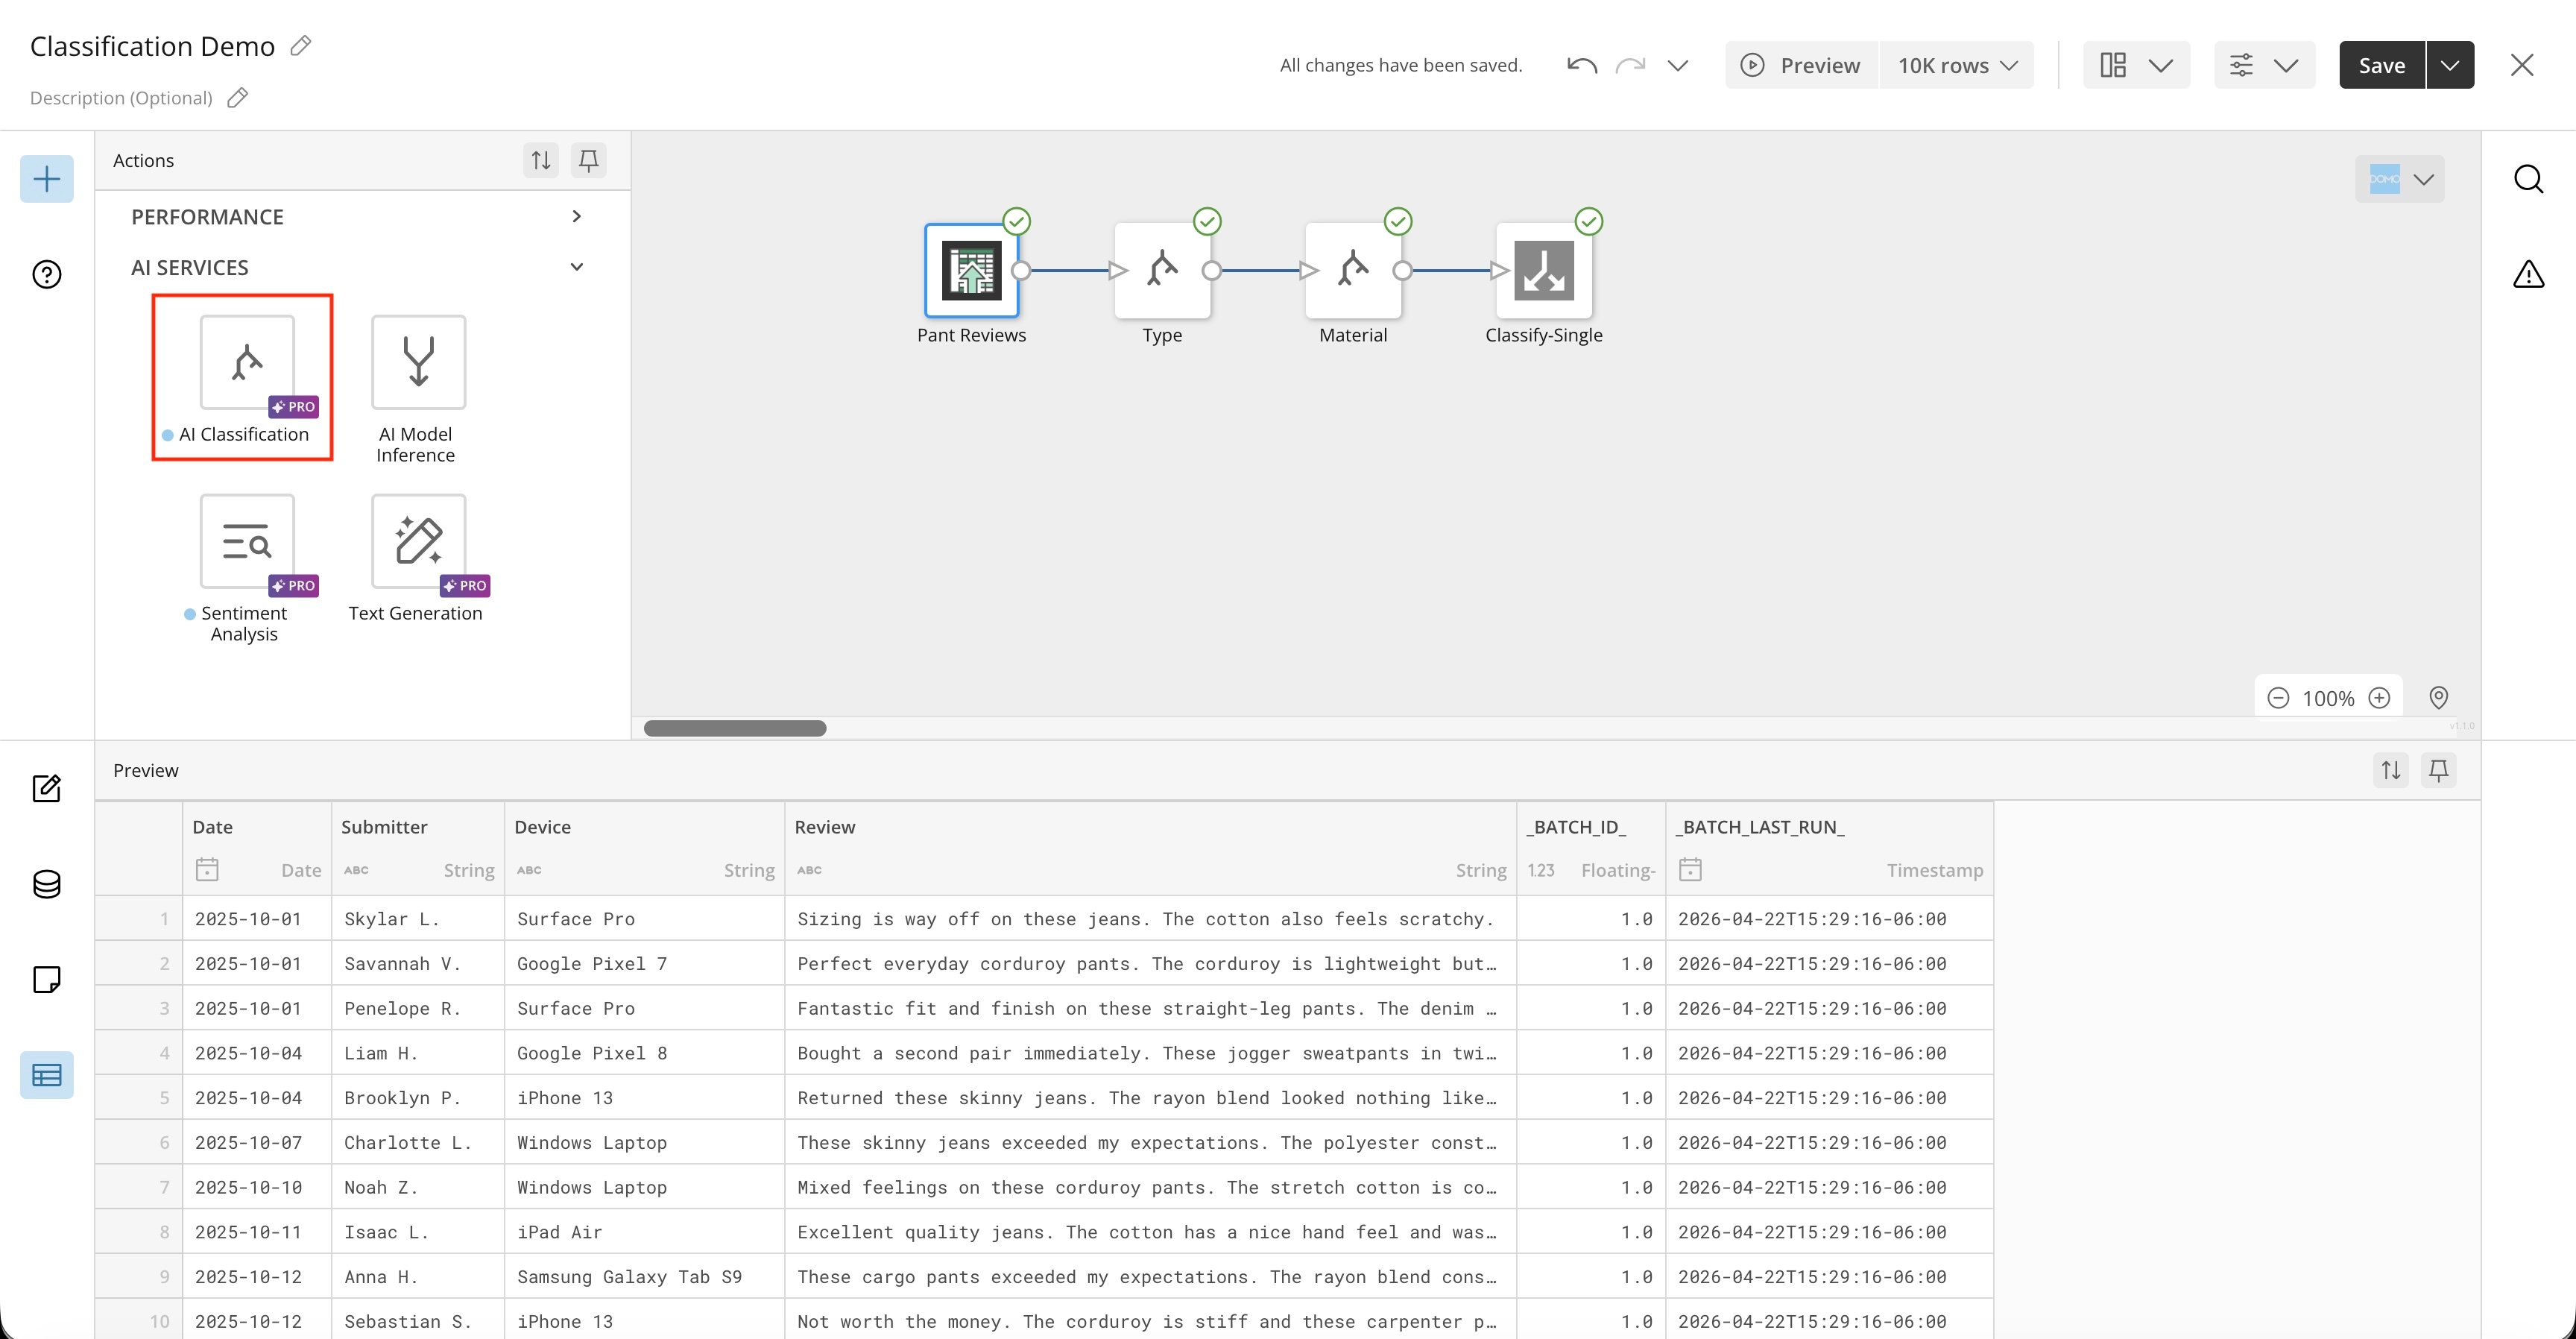
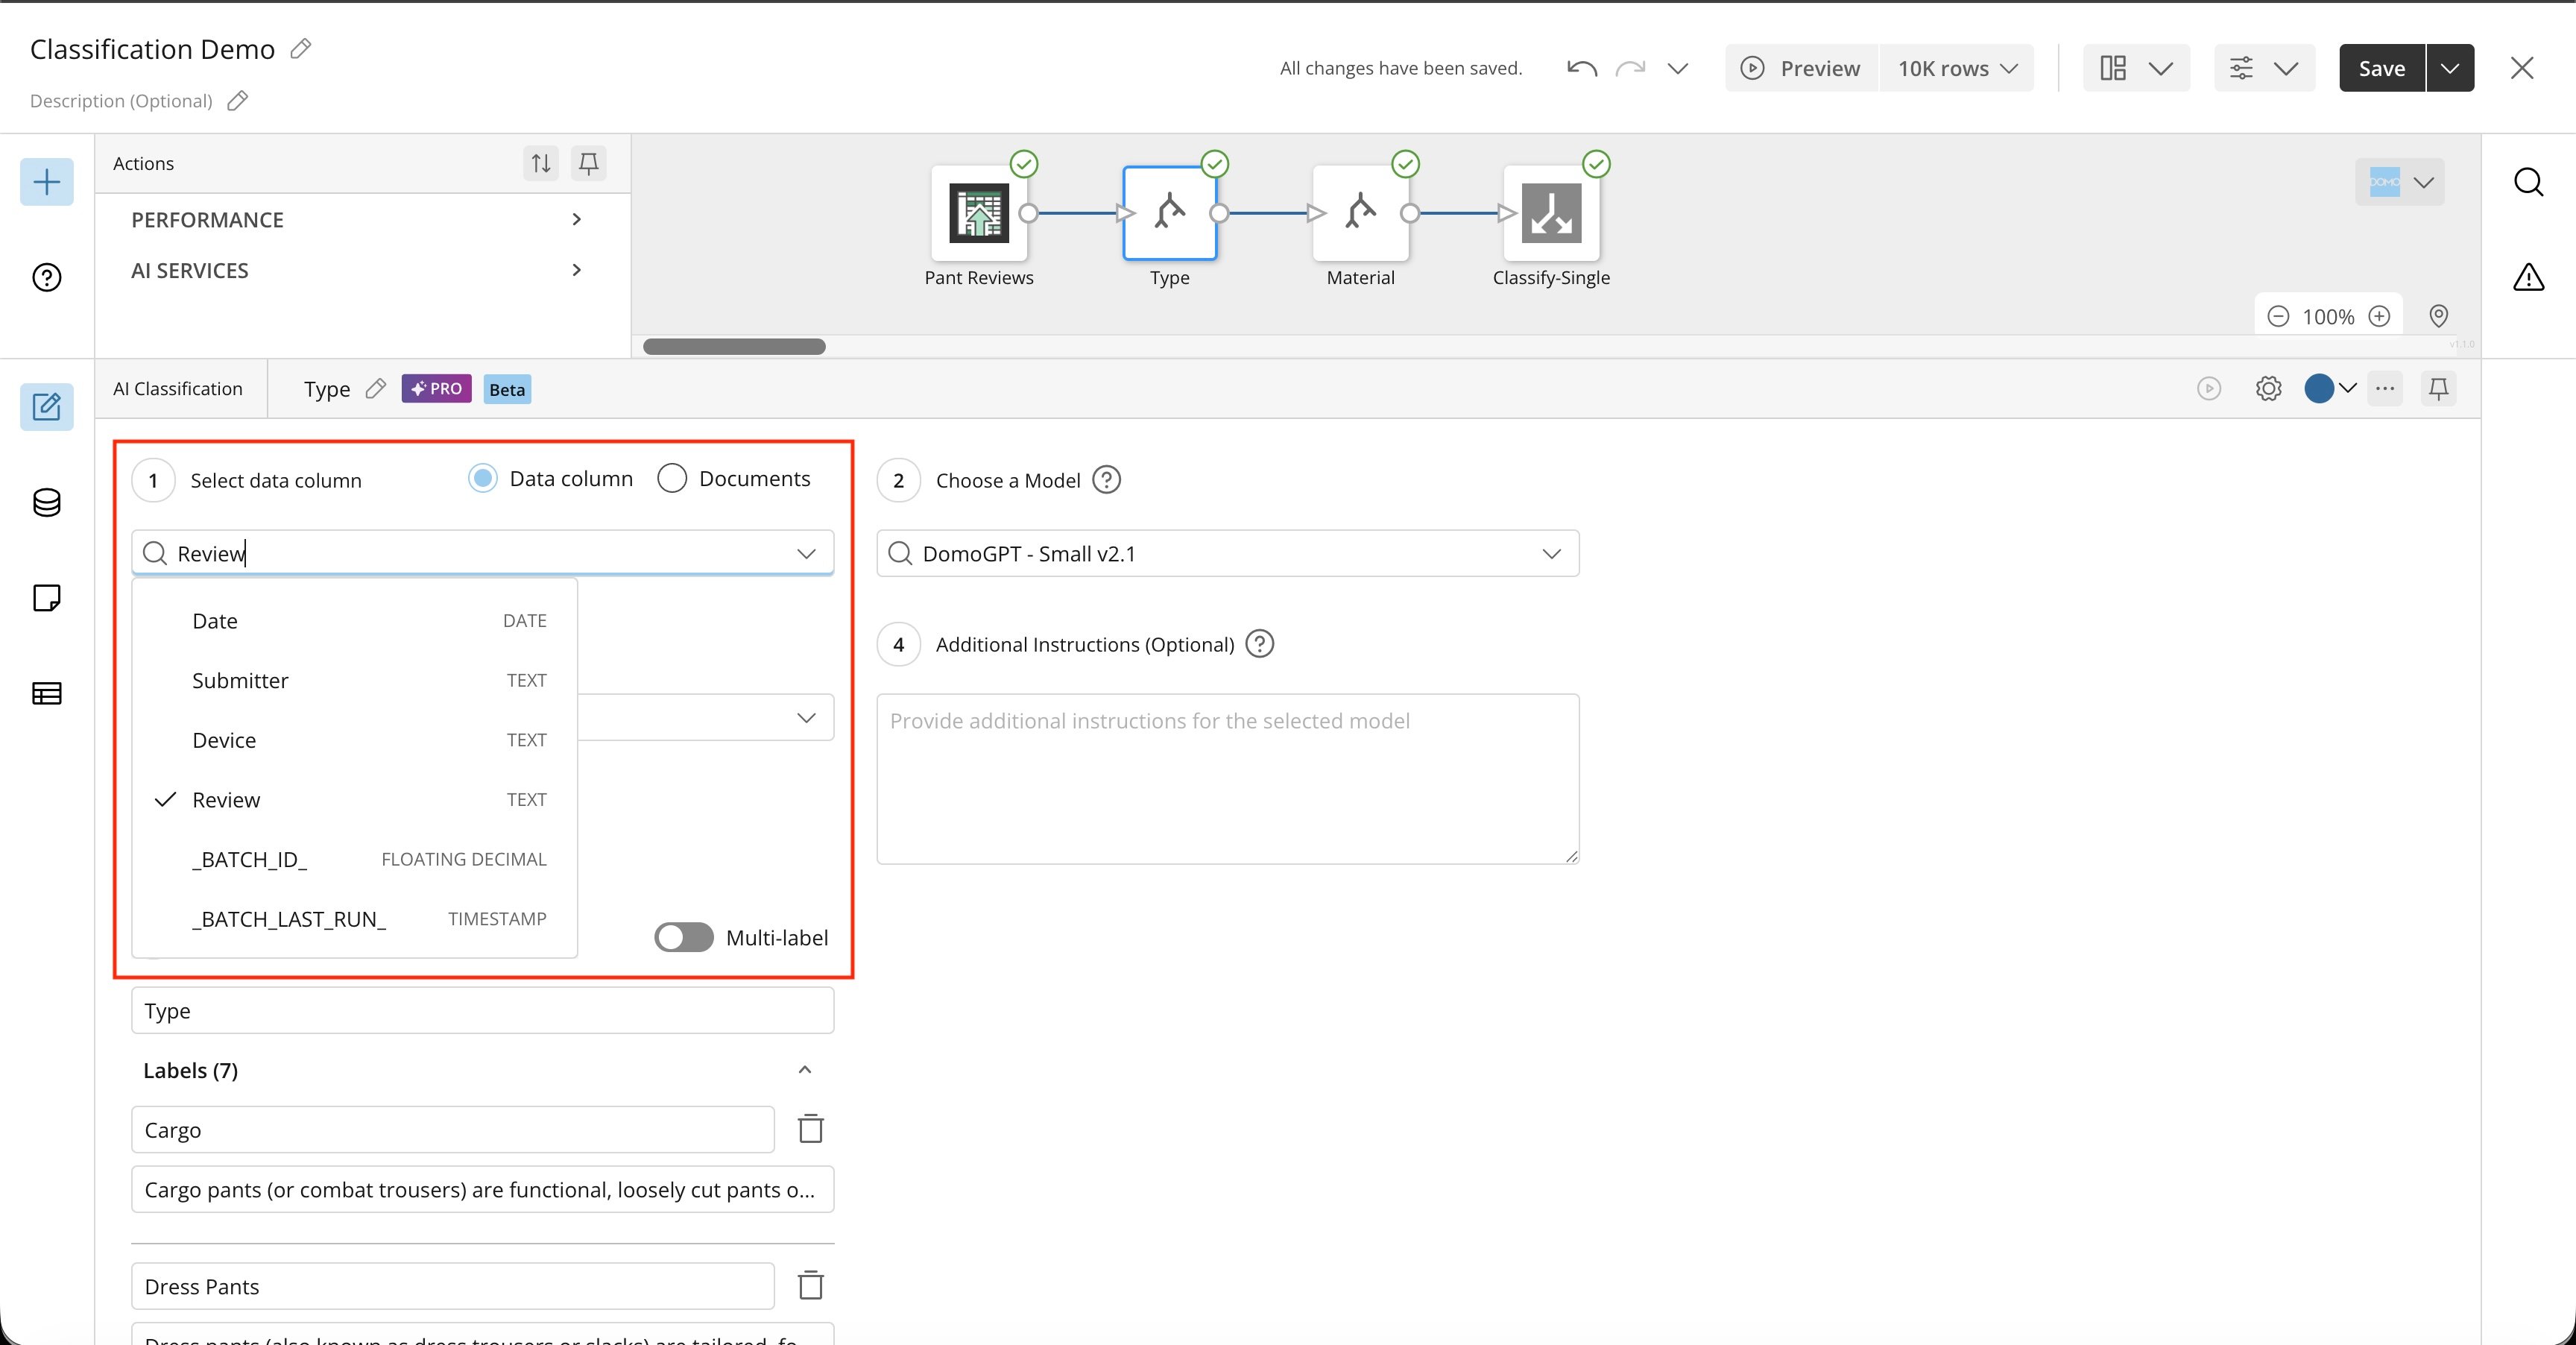
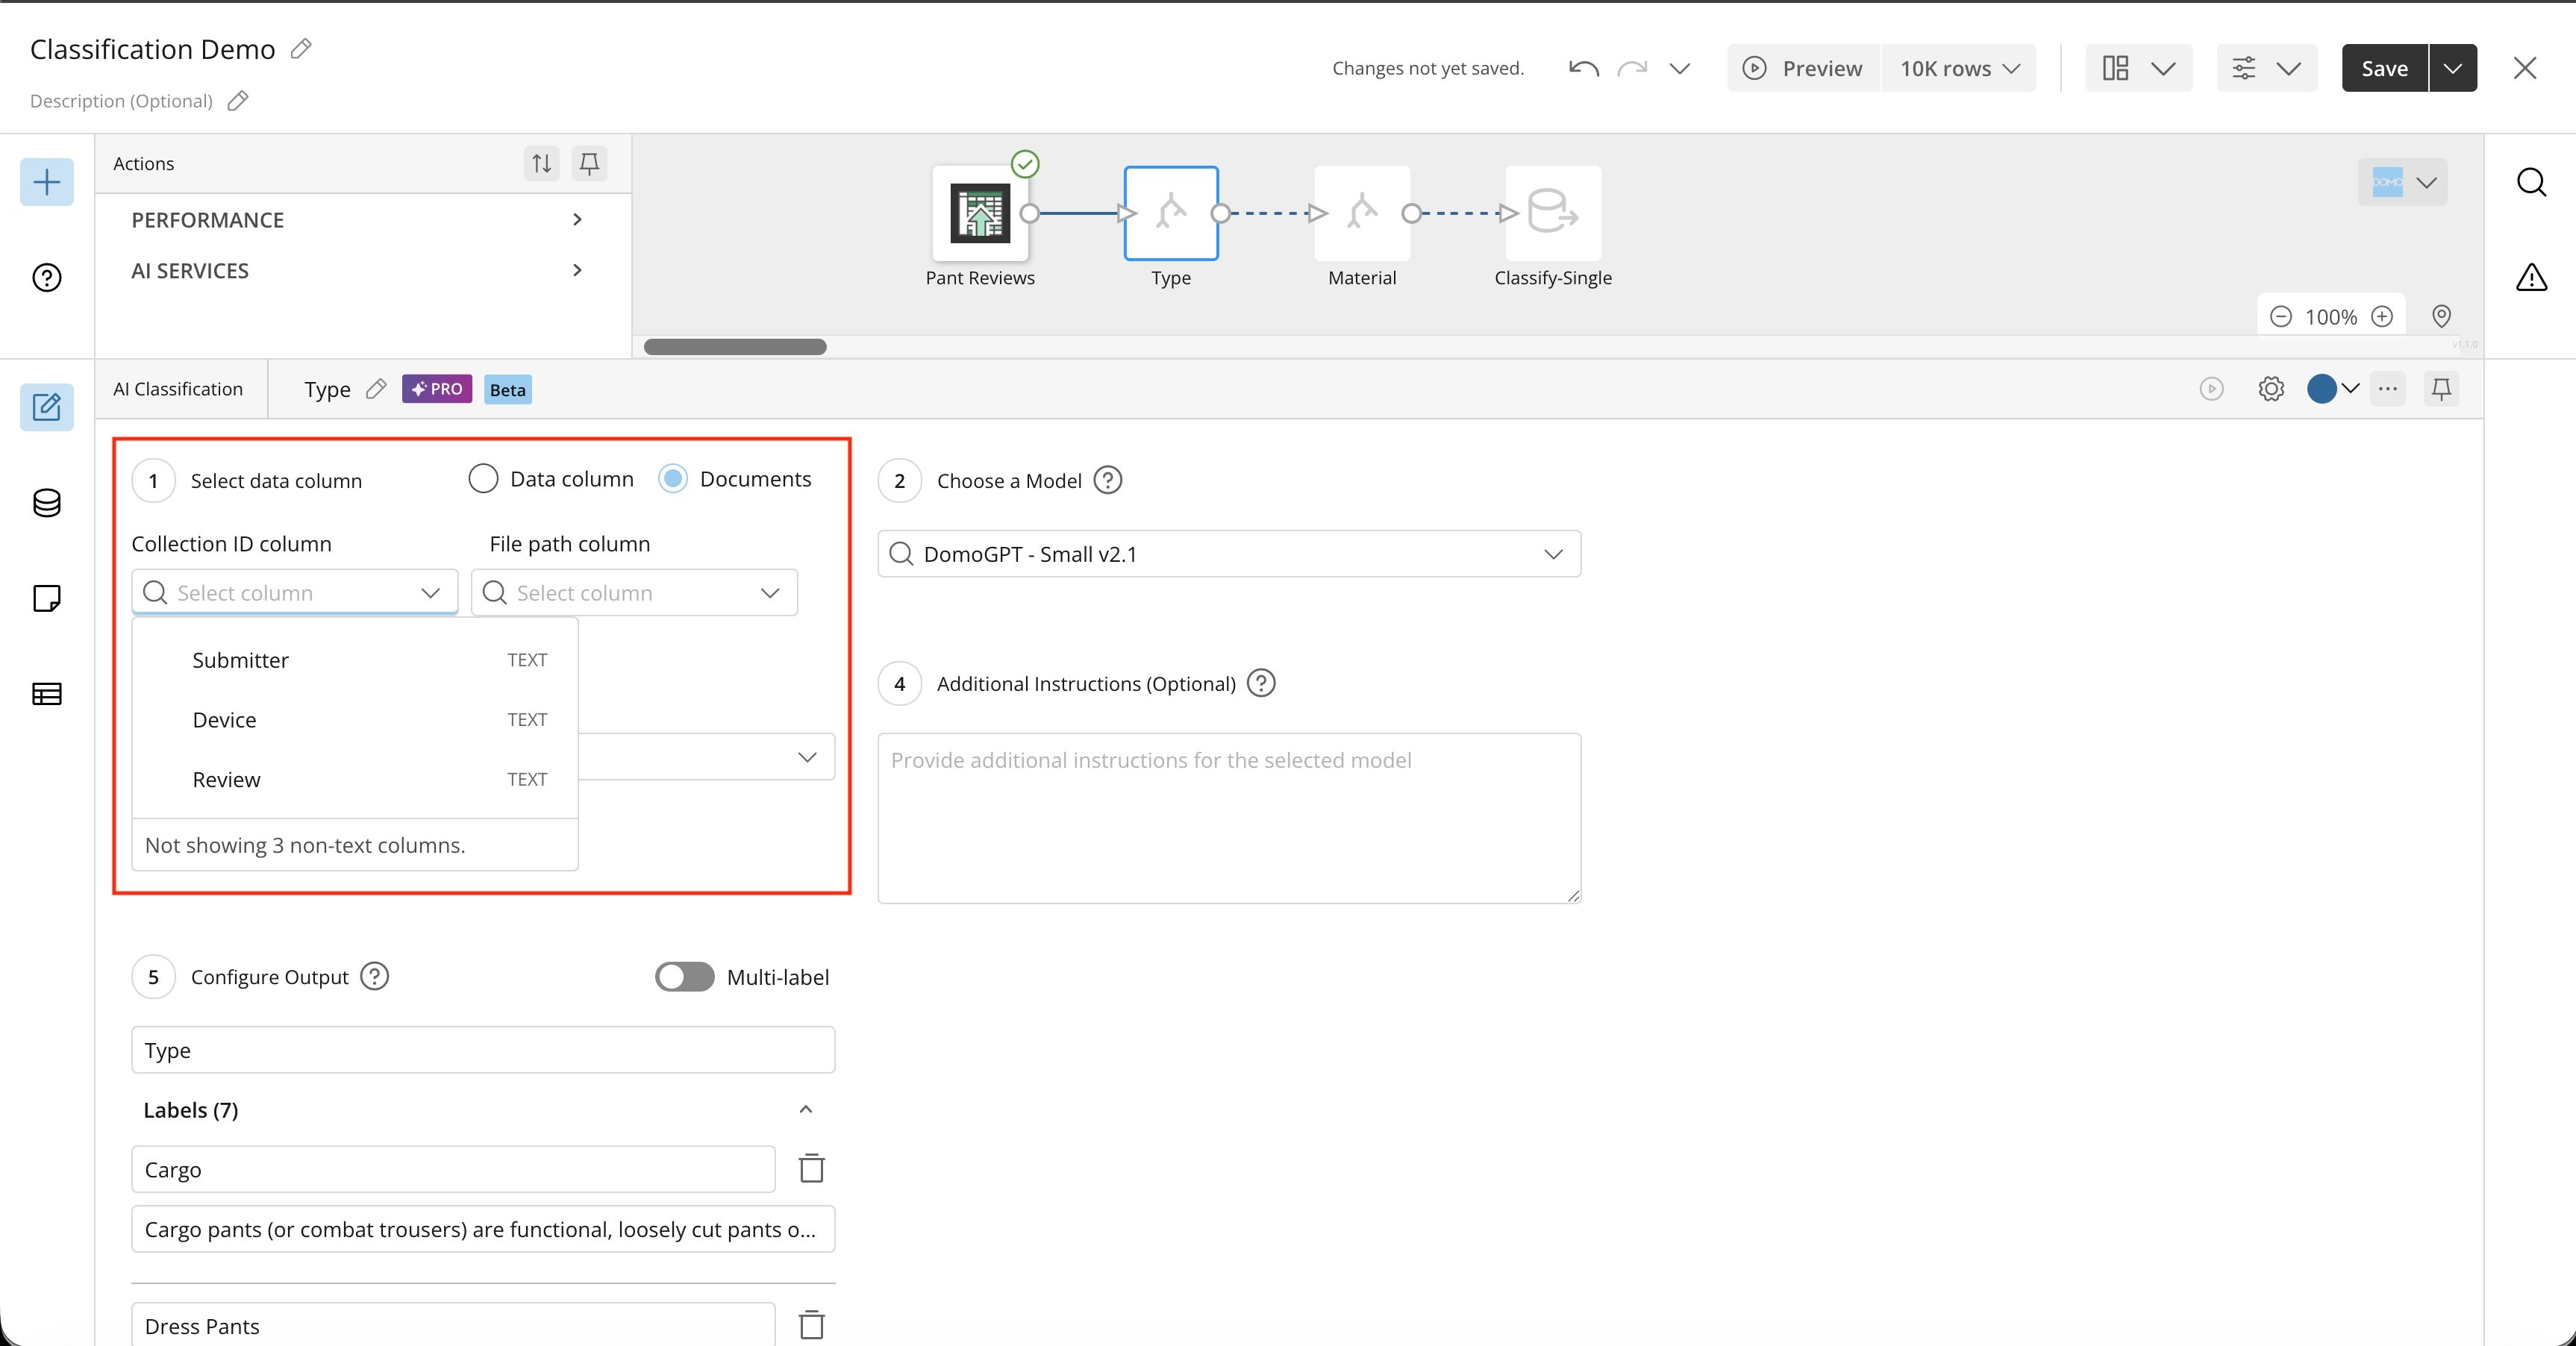
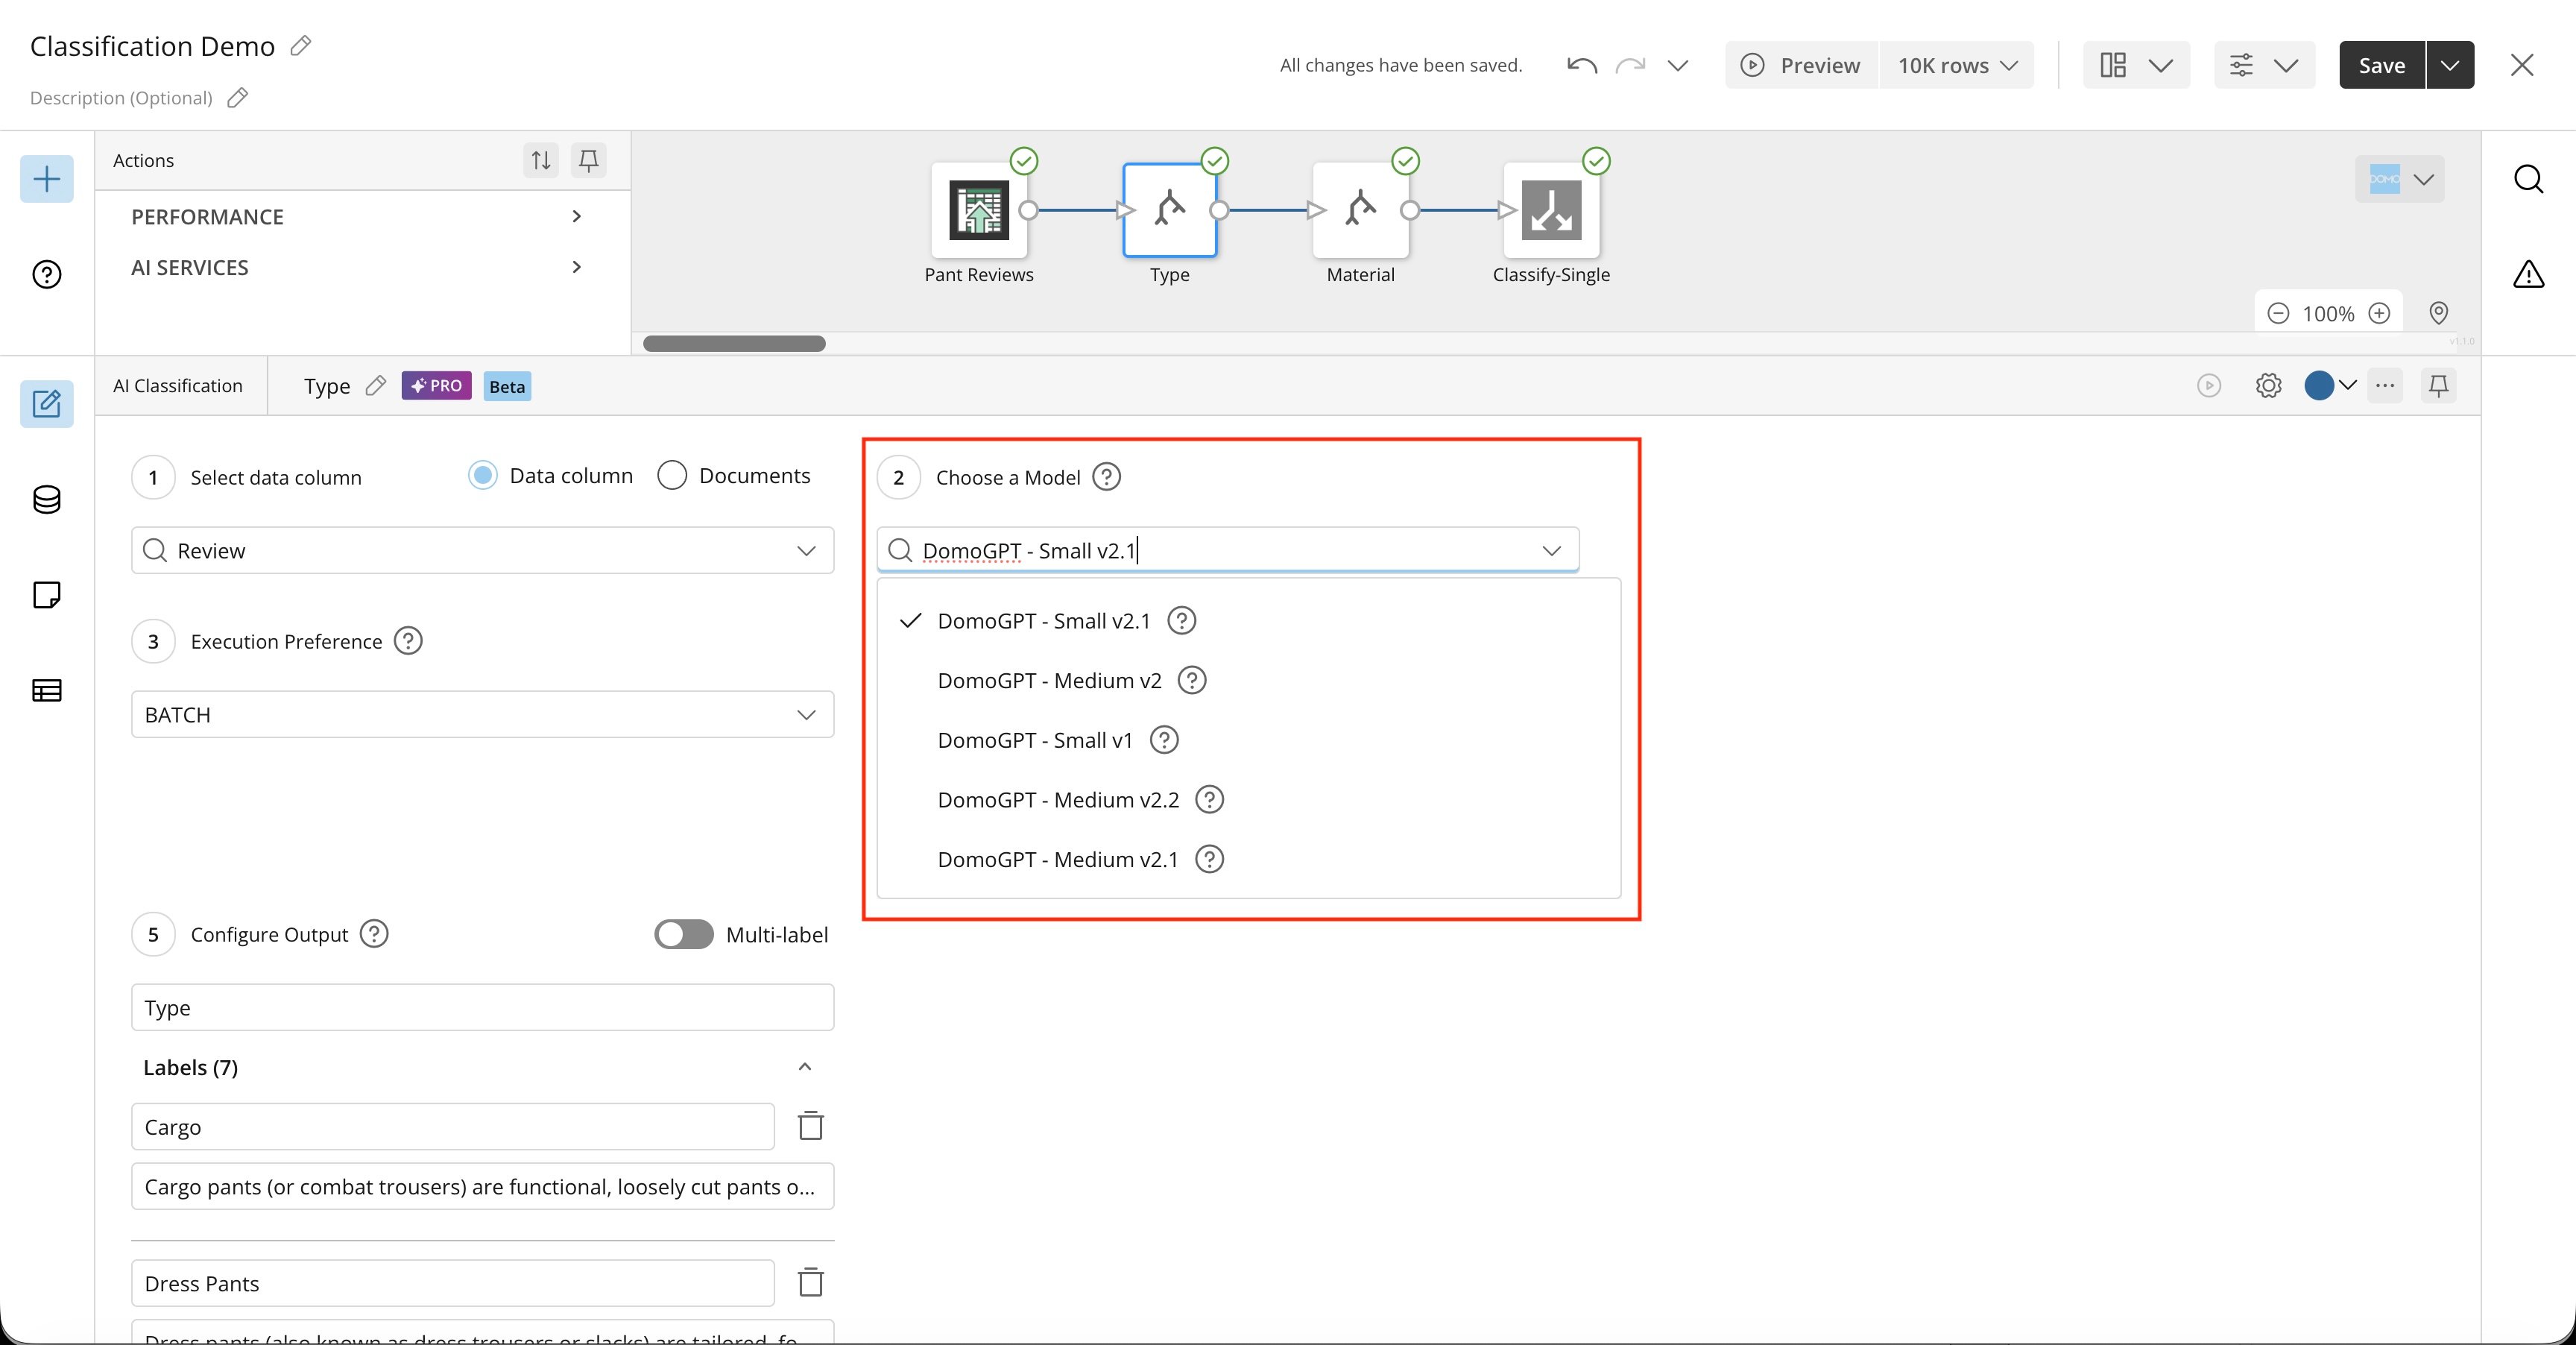
- In the tile editor, choose the AI model you want to use with the Classification tile.
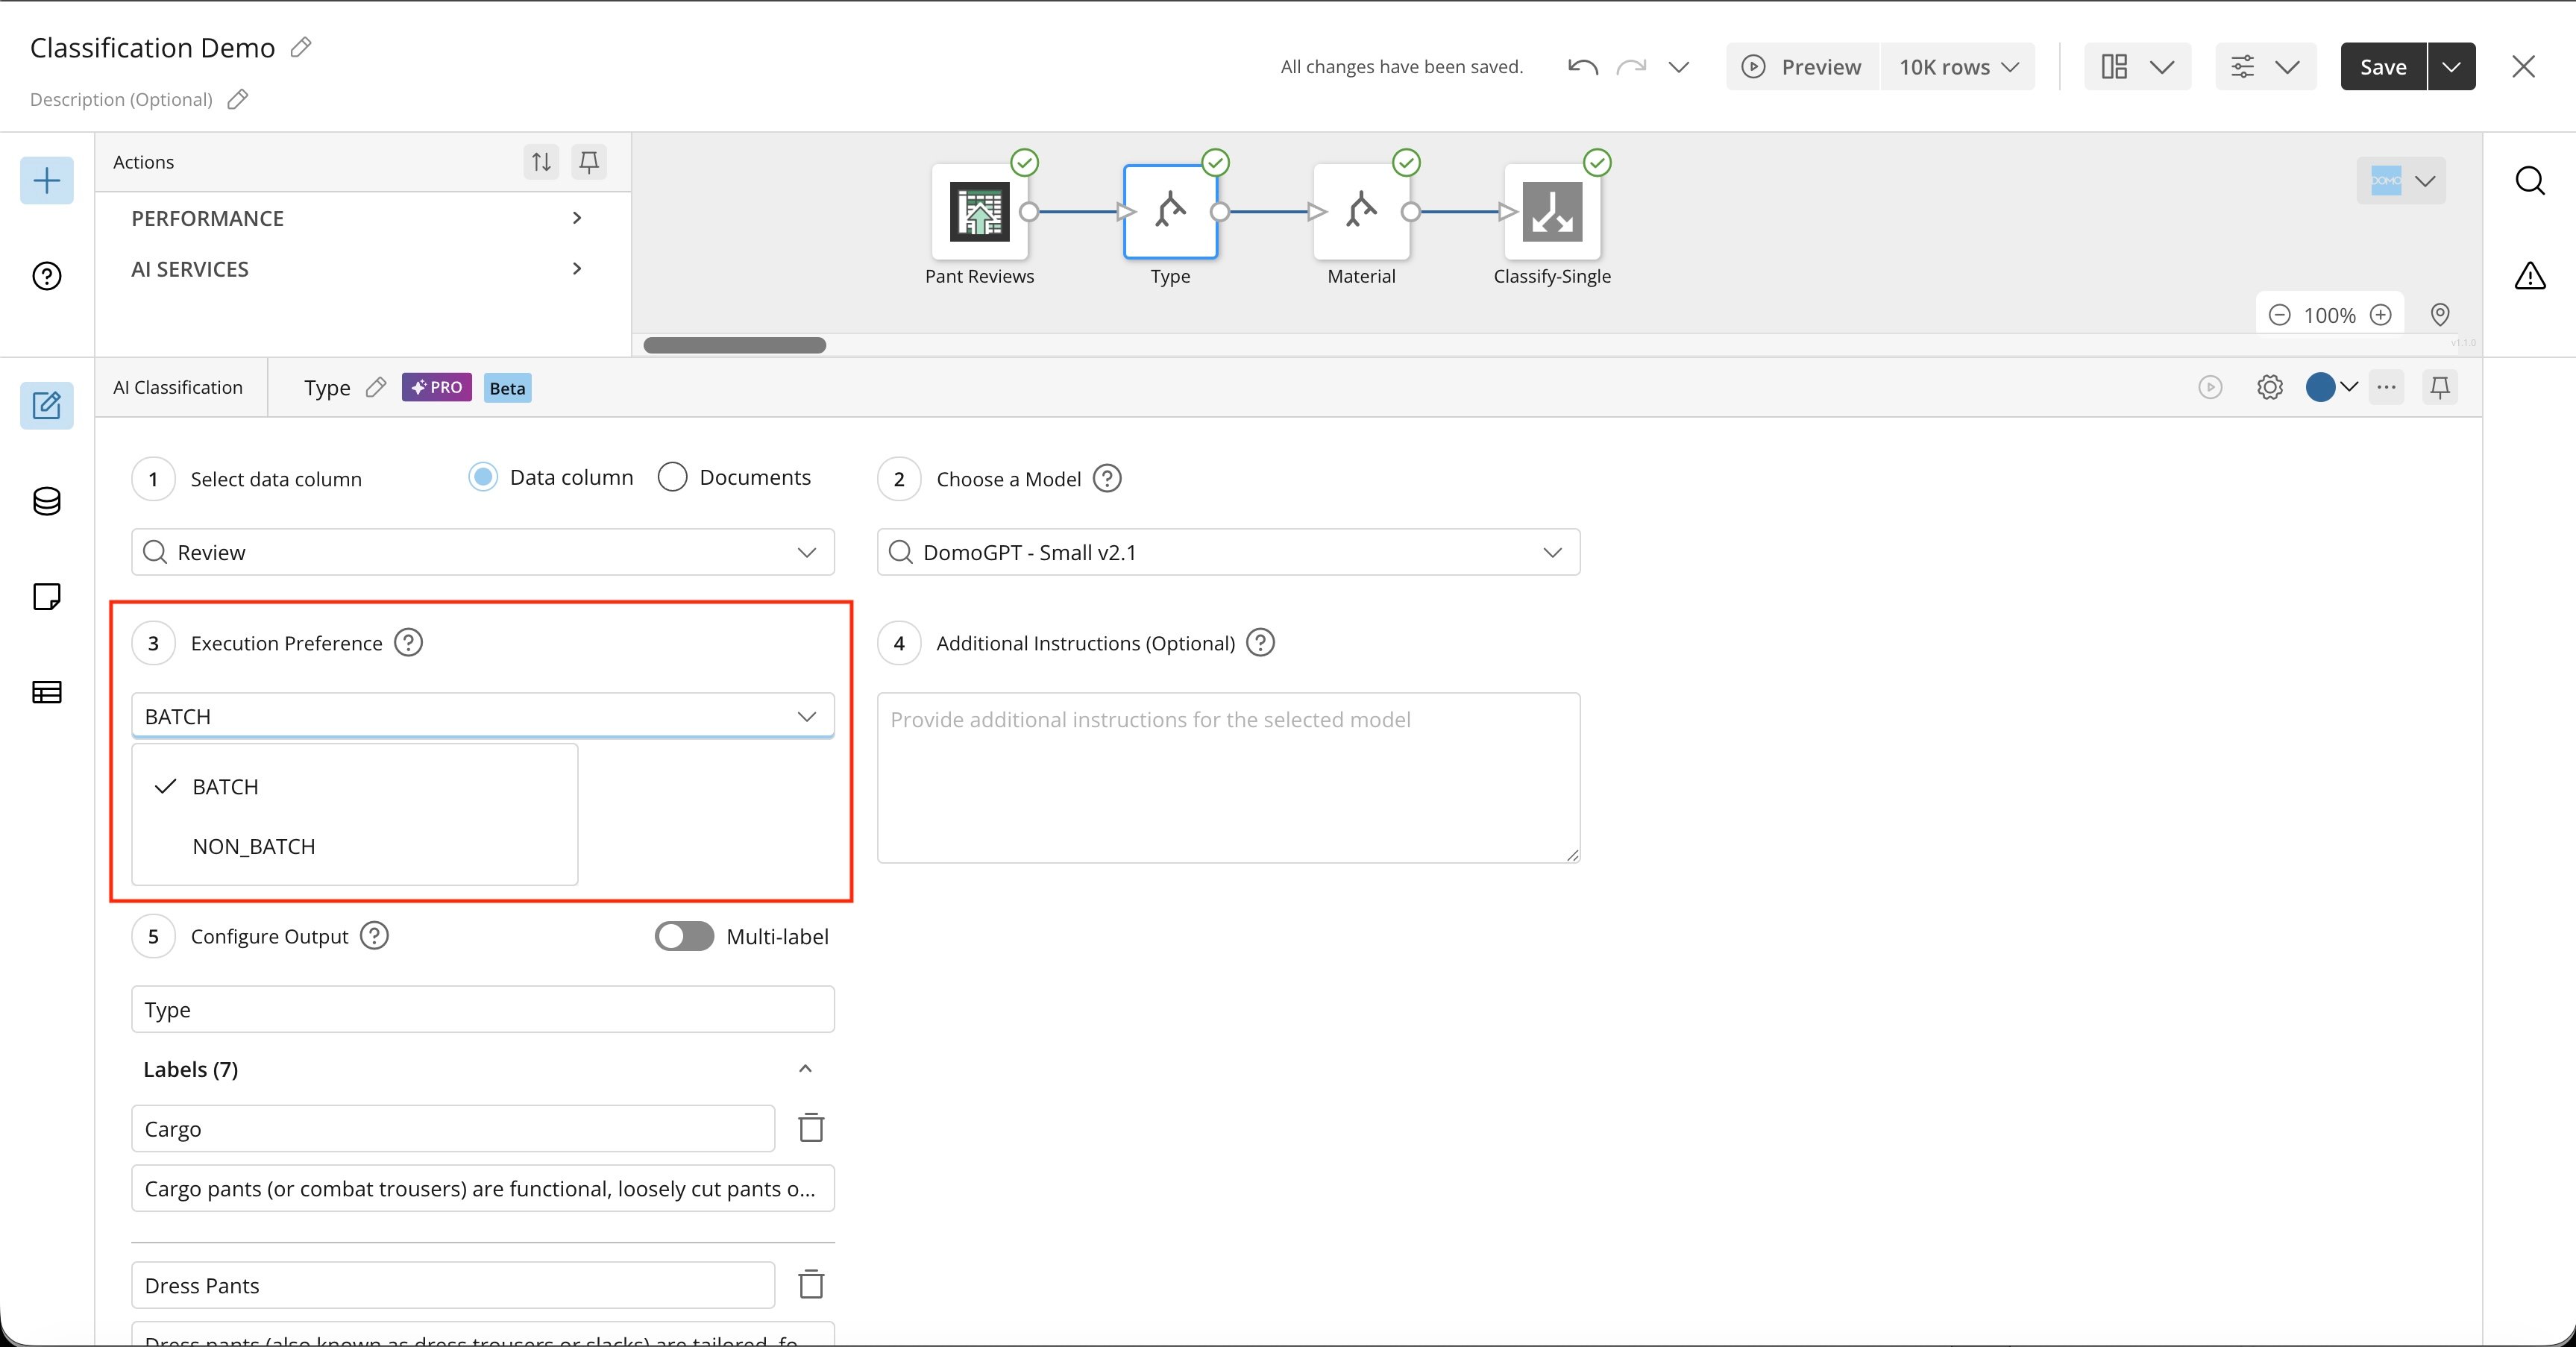
Note: Batch and non-batch processing differ primarily in latency, cost, and use case.Batch processing is designed for high-volume, asynchronous workloads, so execution times vary. It’s generally more cost-effective.Non-batch processing is intended for more consistent execution times with a small number of rows. Non-batch is always used when processing fewer than 100 rows of data.
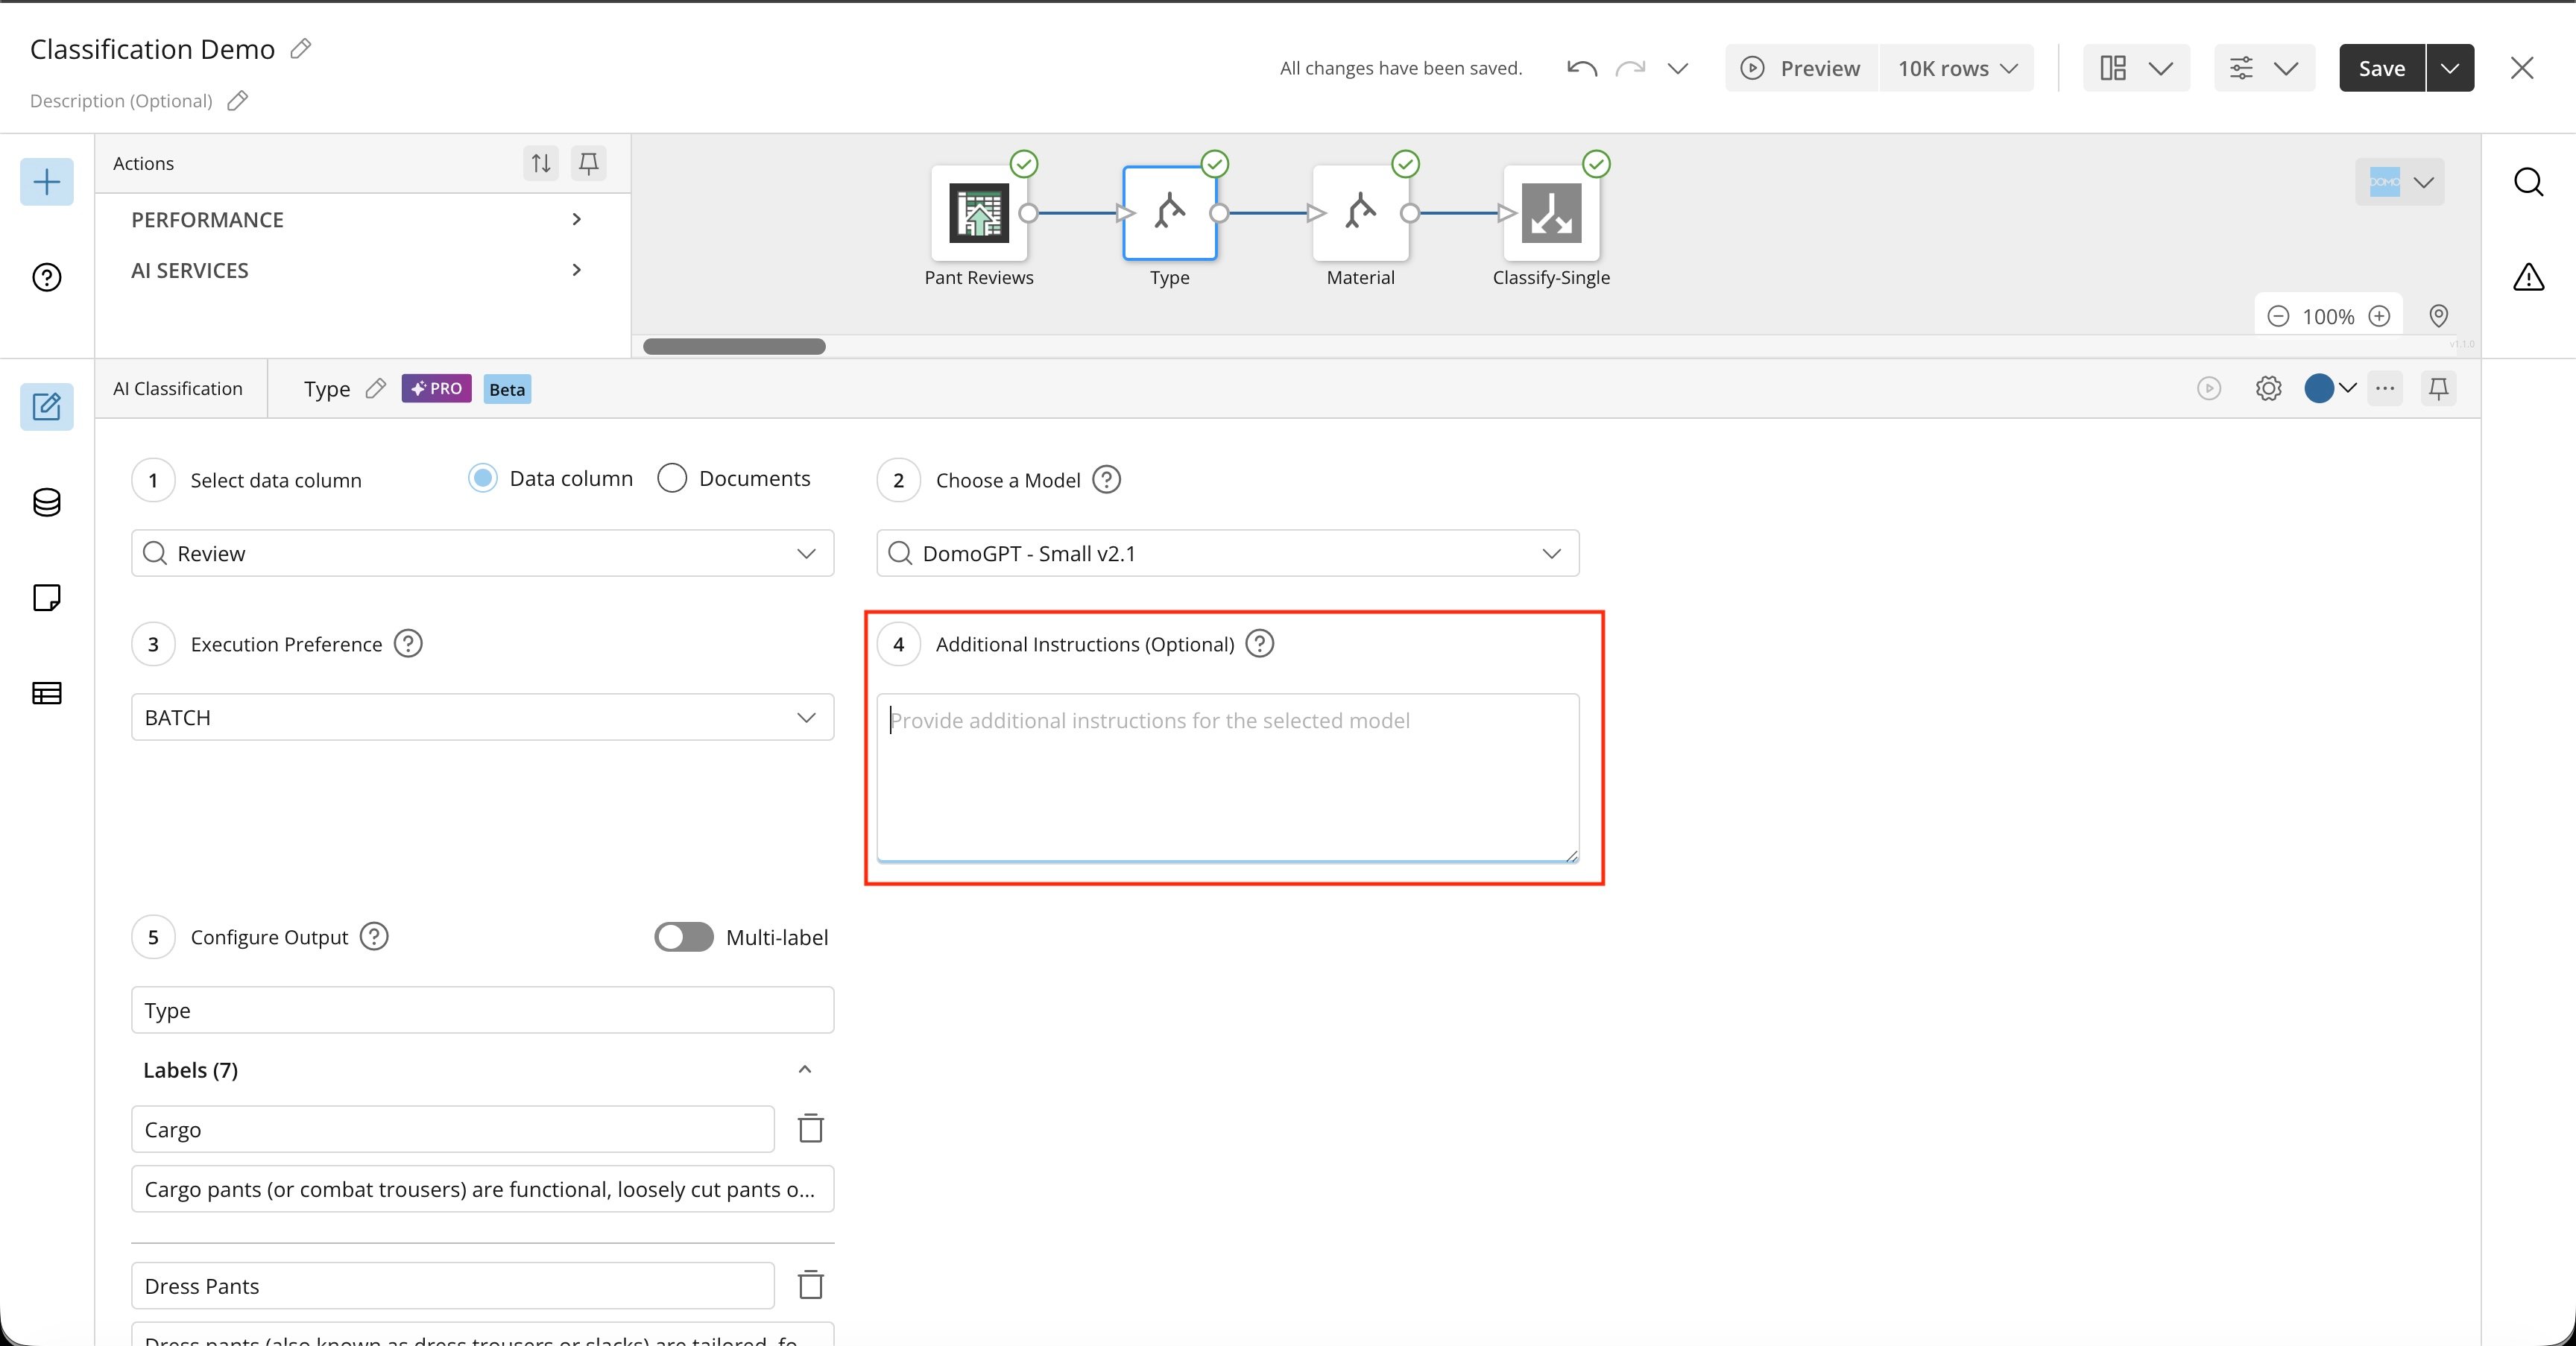
- Provide the model with any additional instructions on how to analyze the column. Be very specific; describe exactly what you want the model to do (and not to do).
-
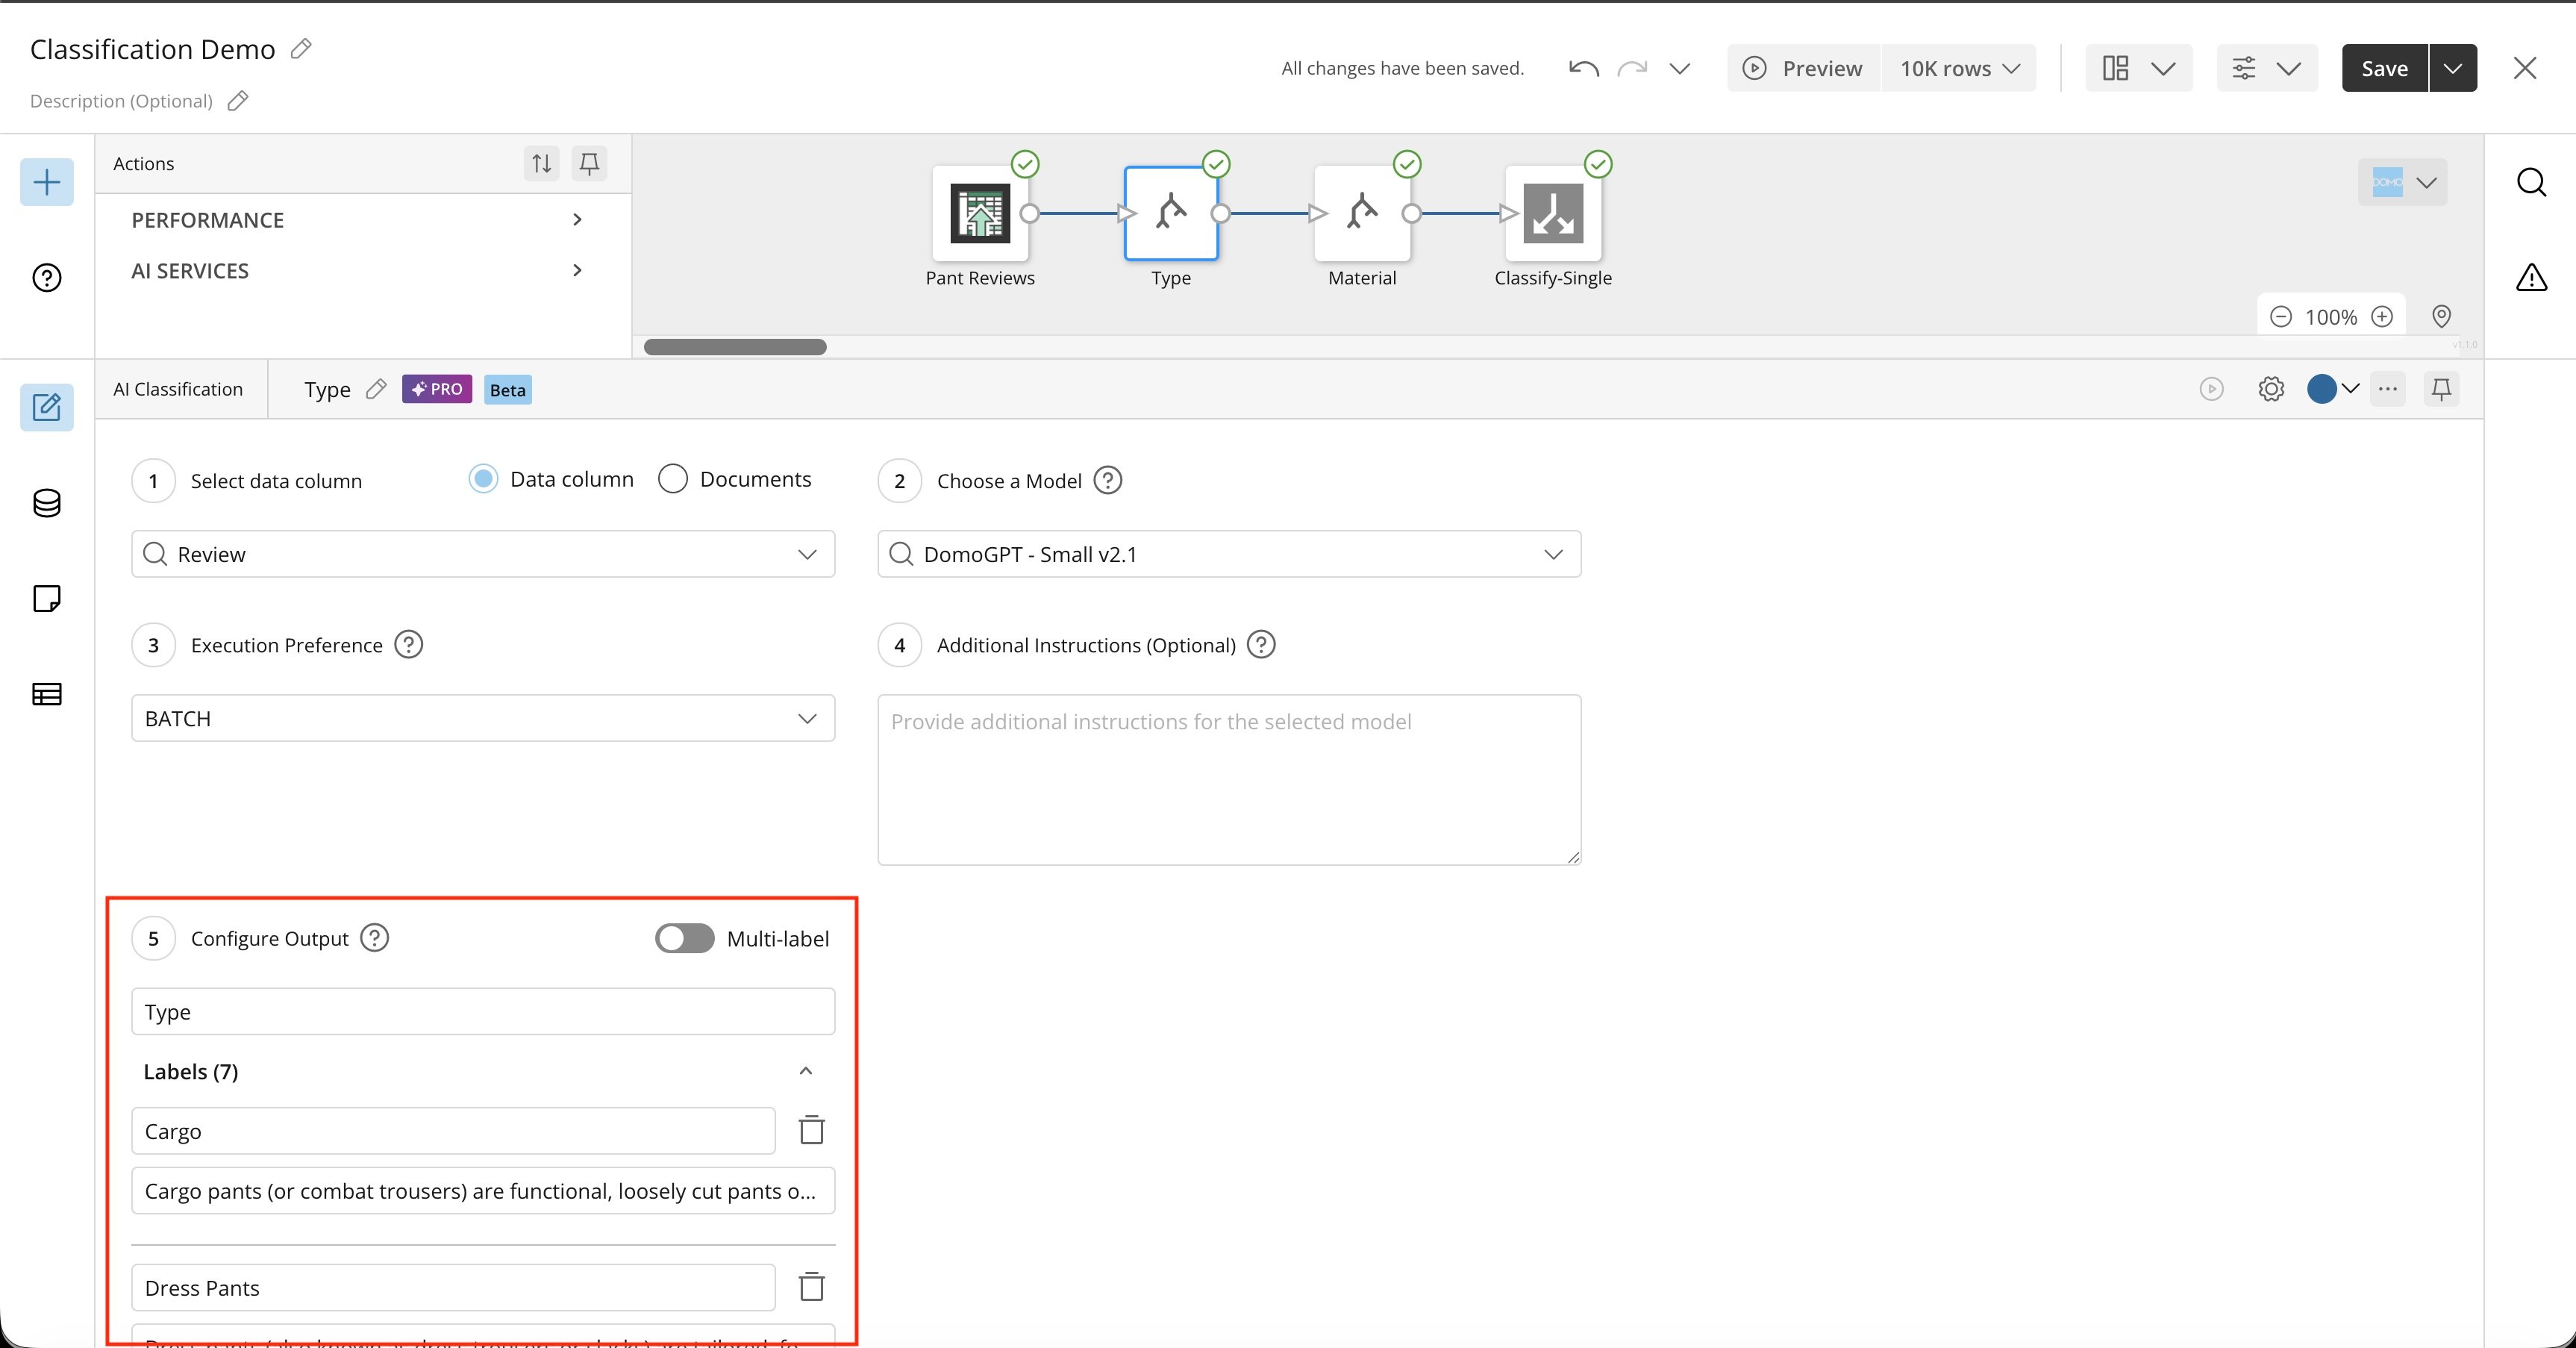
Single Label assigns one class per row. For example, given the classes Corduroy, Denim, and Leather, a row’s
Fabric Typeresolves to a single value: -
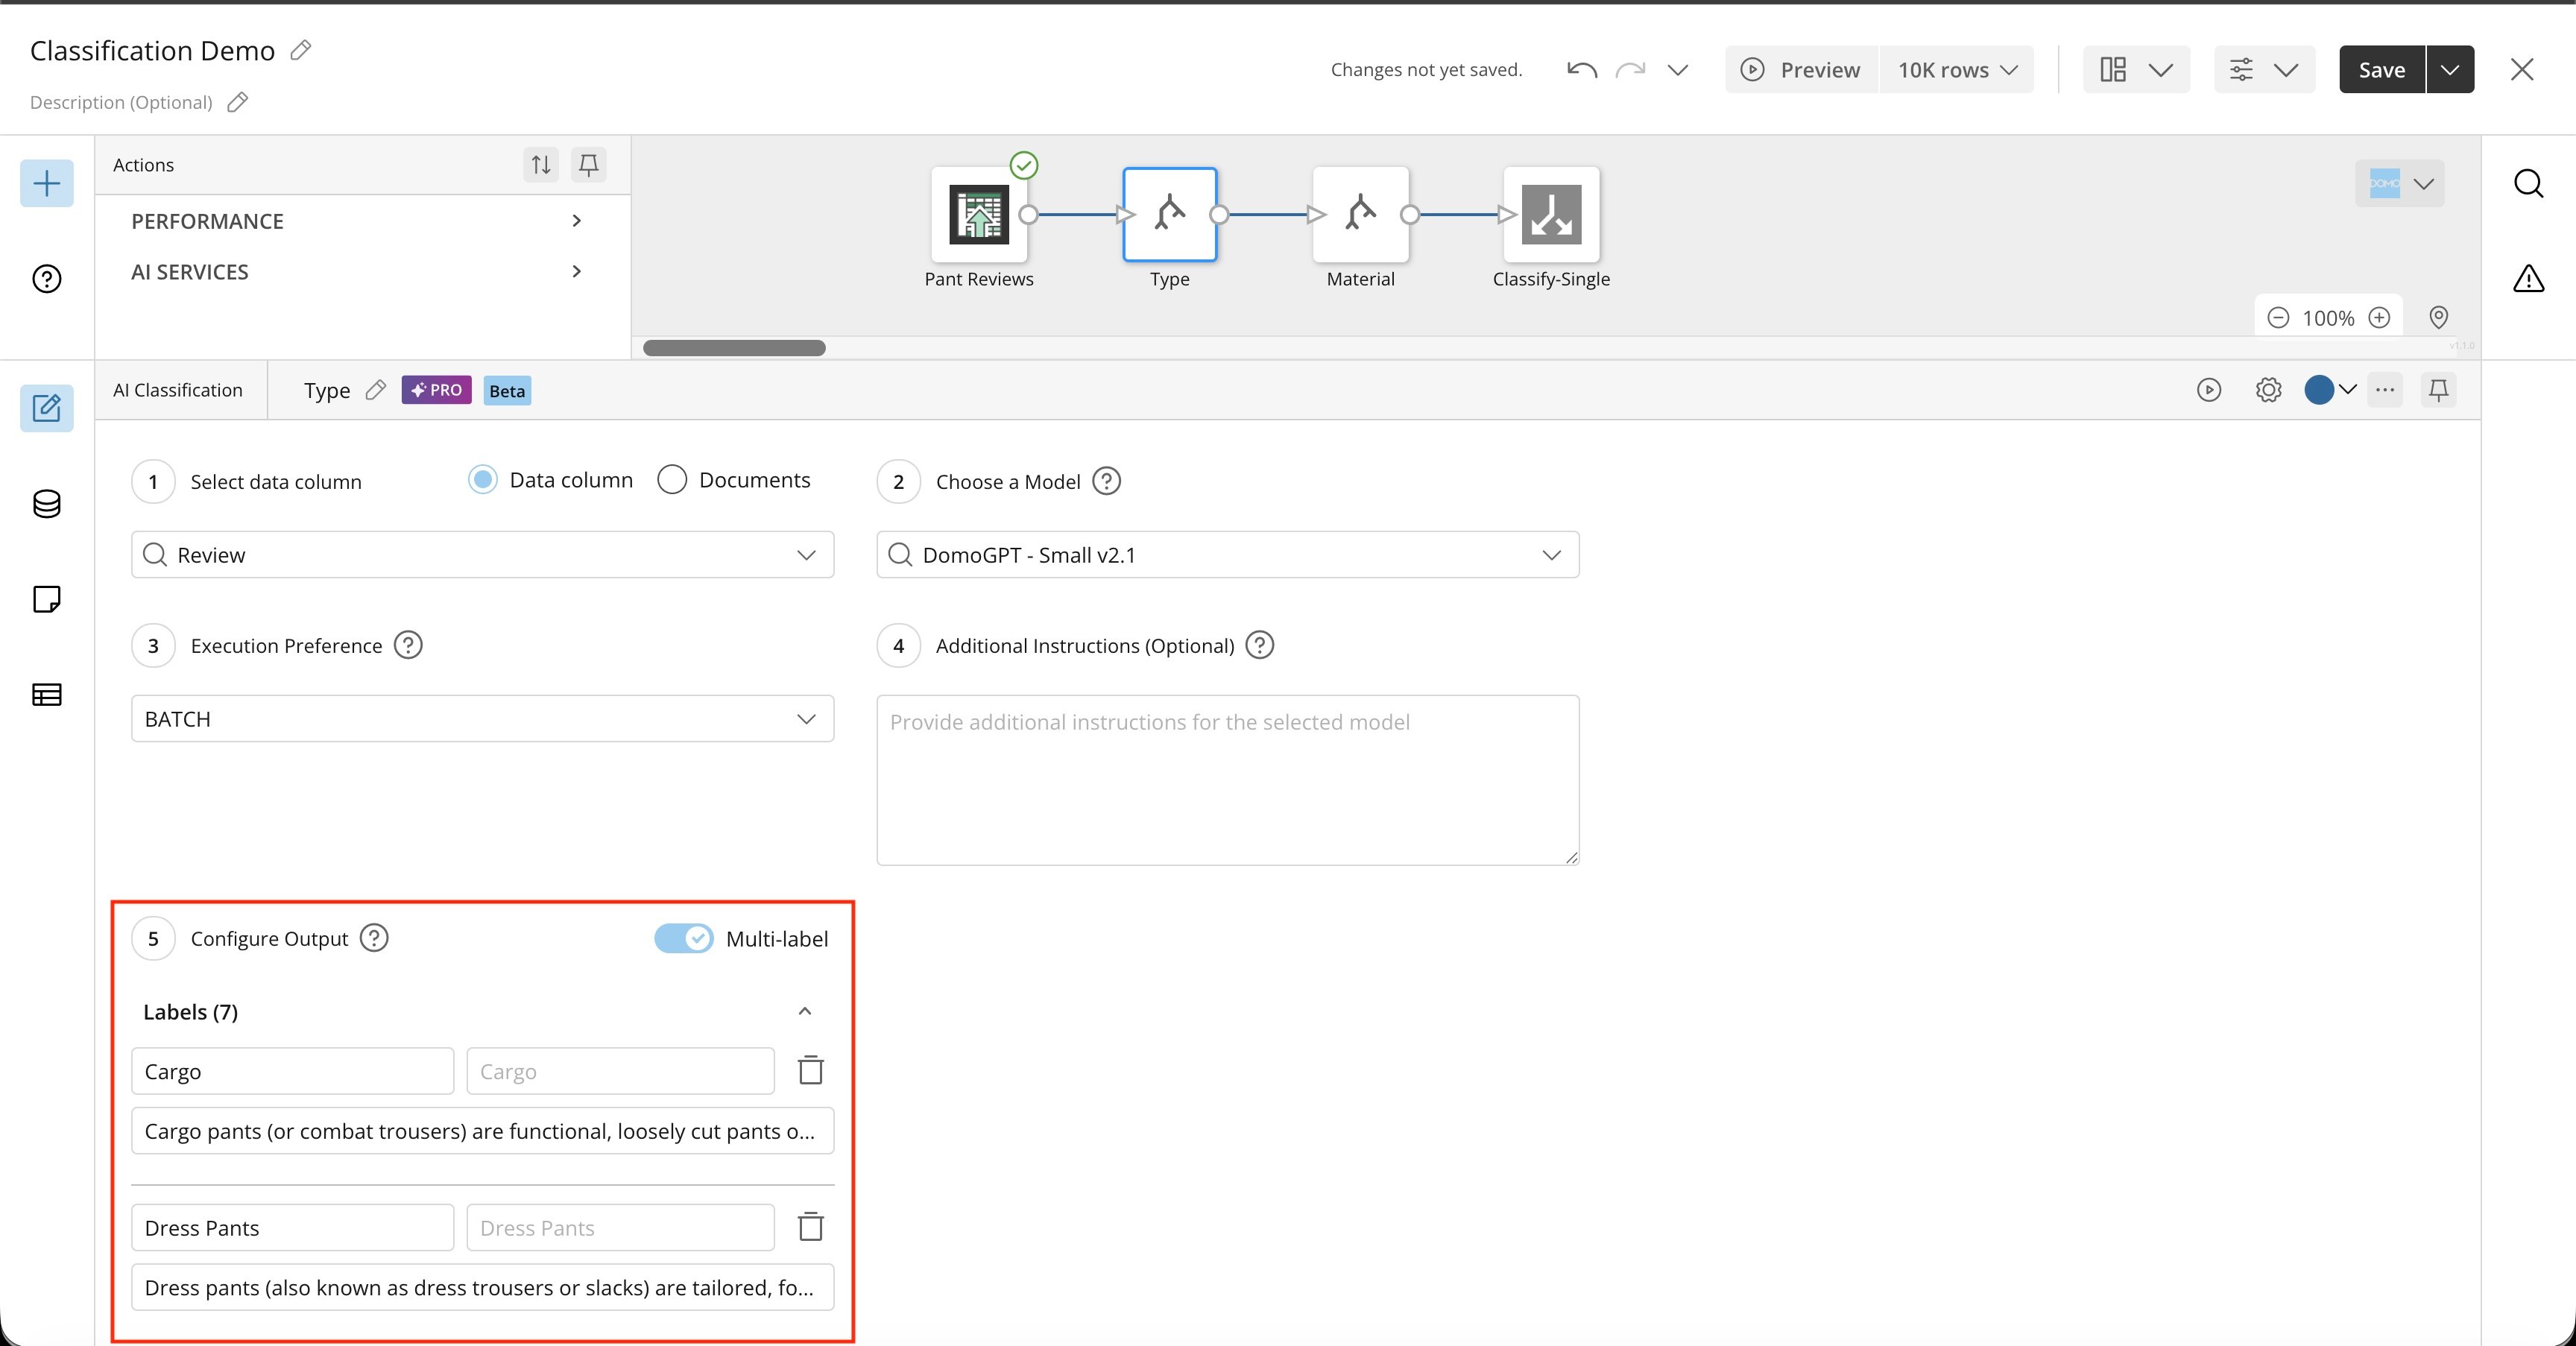
Multi Label evaluates each class independently and returns one-hot-encoded Boolean values. For example, given the classes Corduroy, Denim, Leather, Skinny, and Flare:
- AI Operations: 1 operation per tile
- Tokens: input and output tokens vary based on the prompt and the data volume processed
- You can include multiple Classification tiles in the same DataFlow, tasking them with different aspects of analysis for the column (or analysis of different columns).
FAQ
Can I use my own model in the Classification tile?
Can I use my own model in the Classification tile?
Not currently, but this capability is on the roadmap.
Can you output multiple columns from a single Classification tile?
Can you output multiple columns from a single Classification tile?
Yes, you can enable Multi Label output.
Sentiment Analysis Tile Beta
Required Grants
To access the Sentiment Analysis tile in Magic ETL, the following grants must be enabled for your role:- Execute AutoML
- Create AI Service Models
- Use AI Services
Configure the Sentiment Analysis Tile
- Open the Magic ETL canvas and choose an input DataSet that contains a text column you want to analyze.
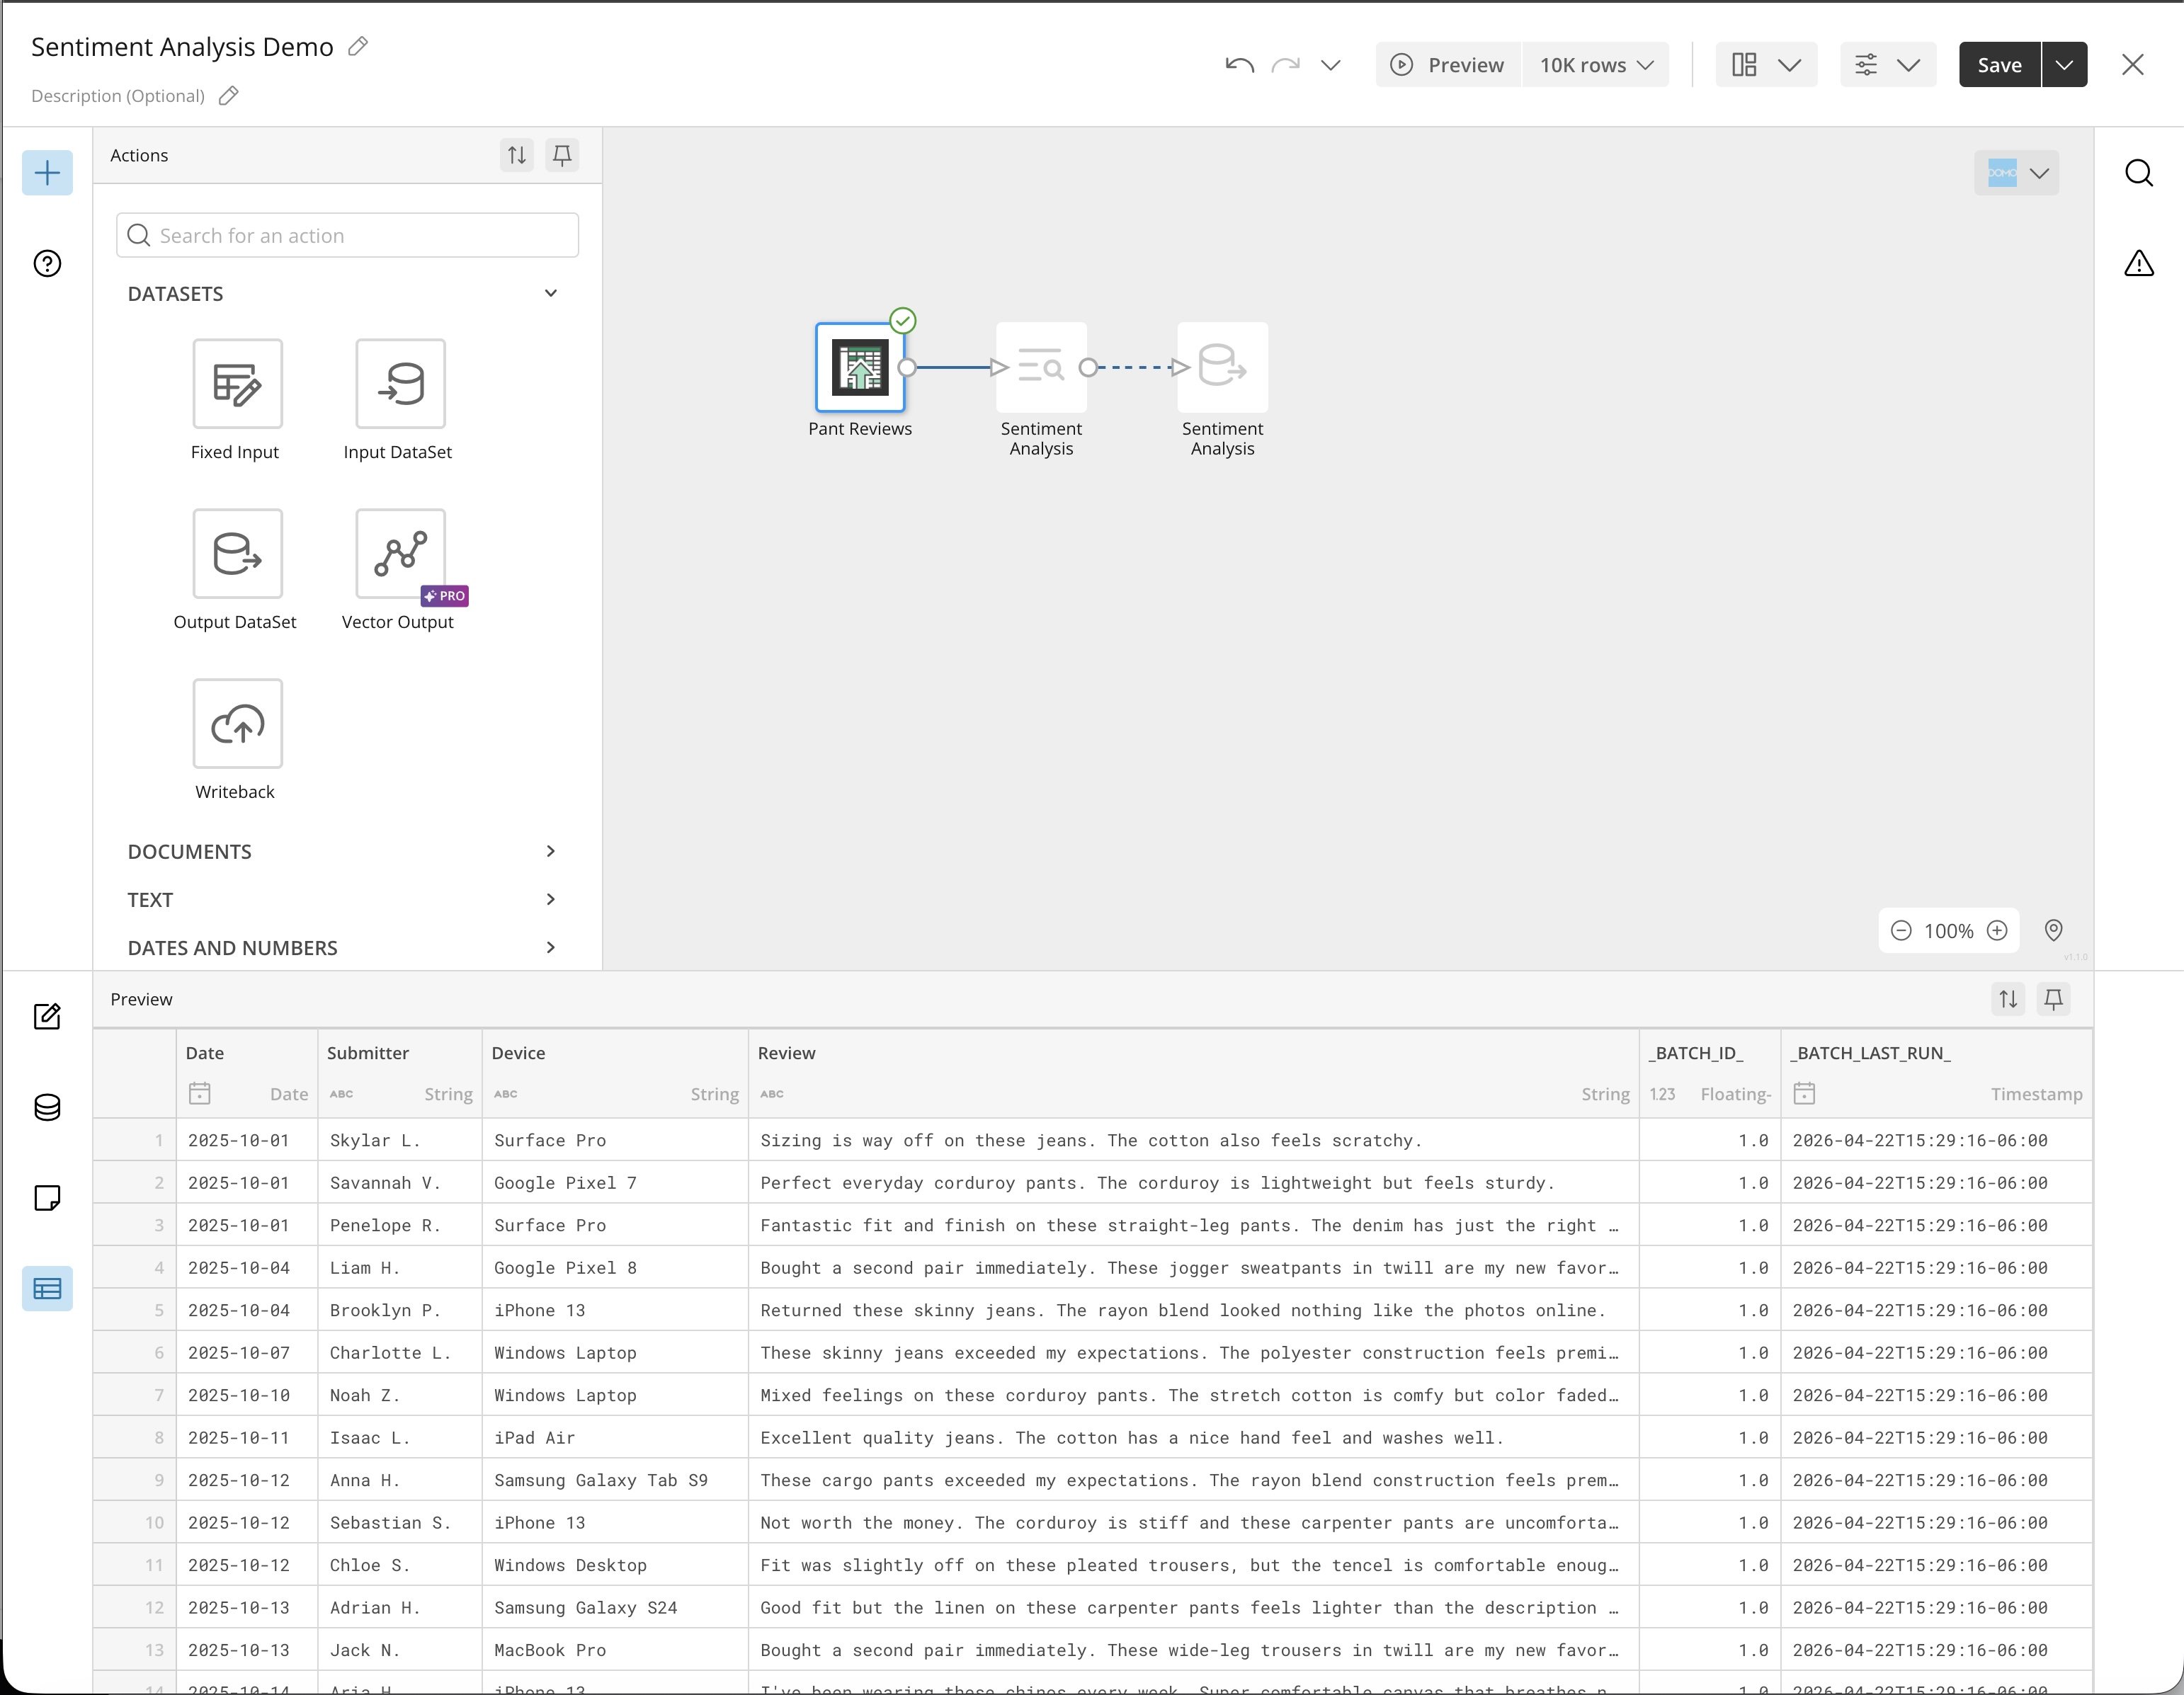
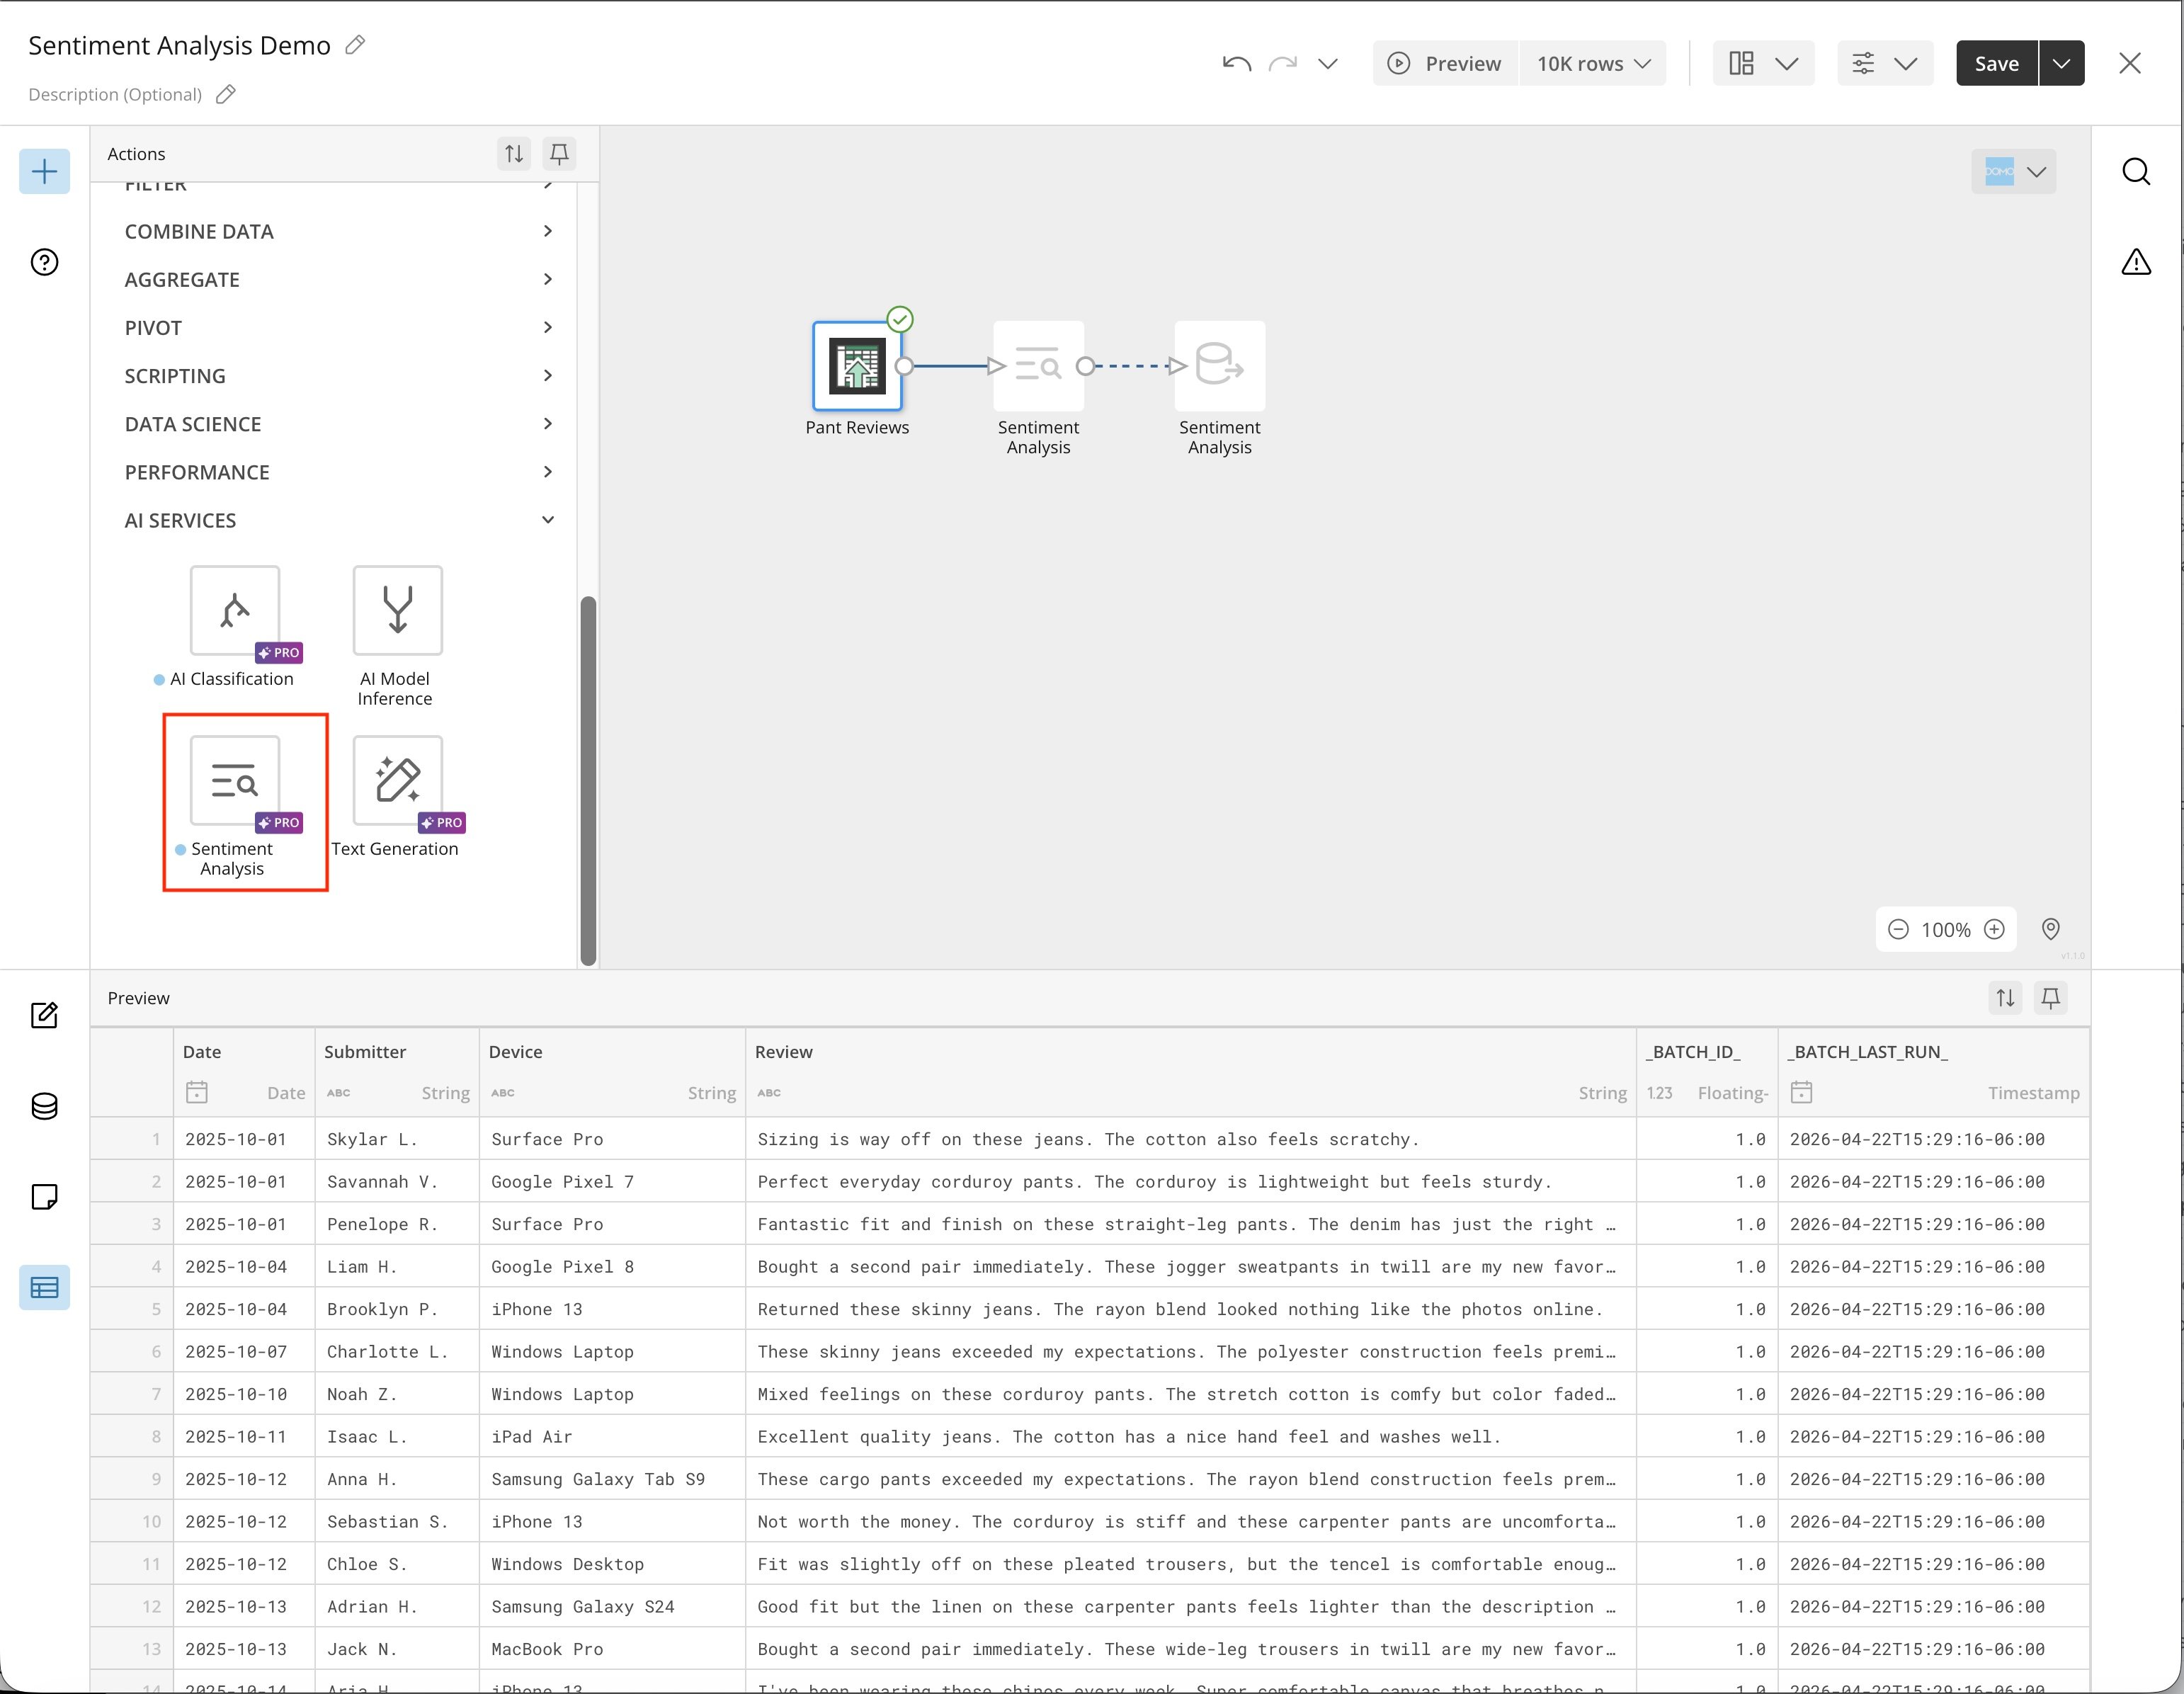
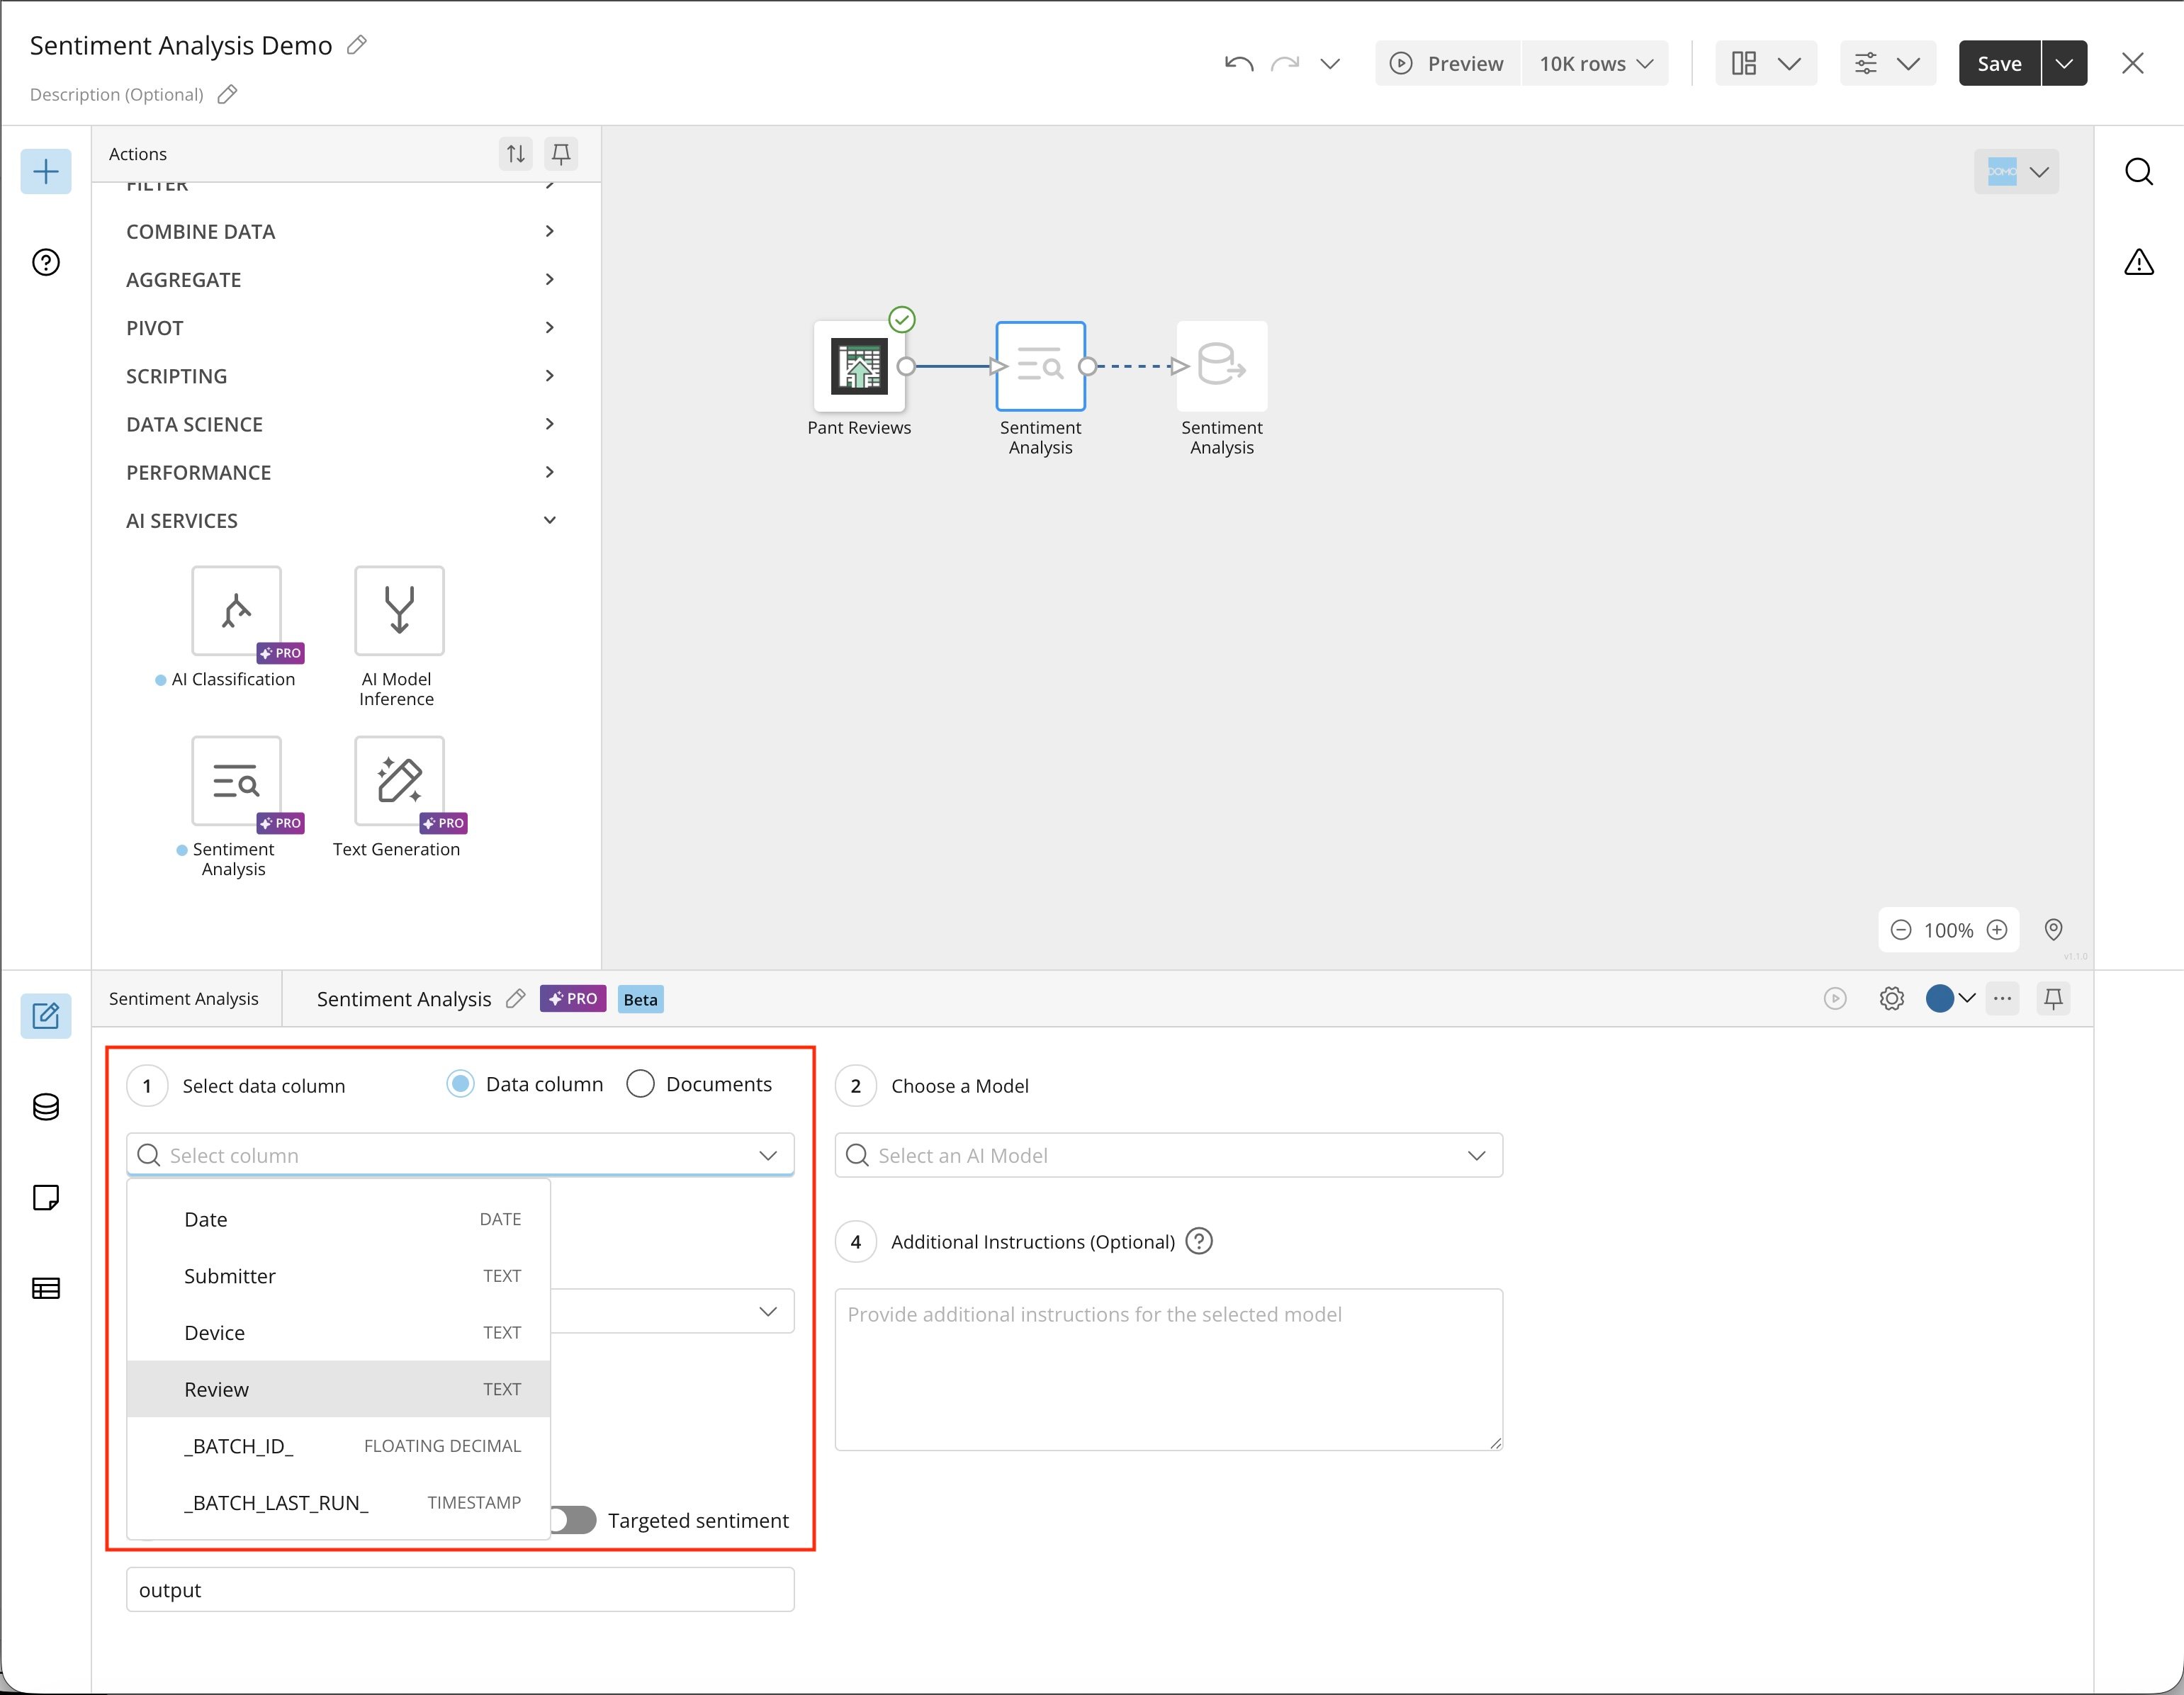
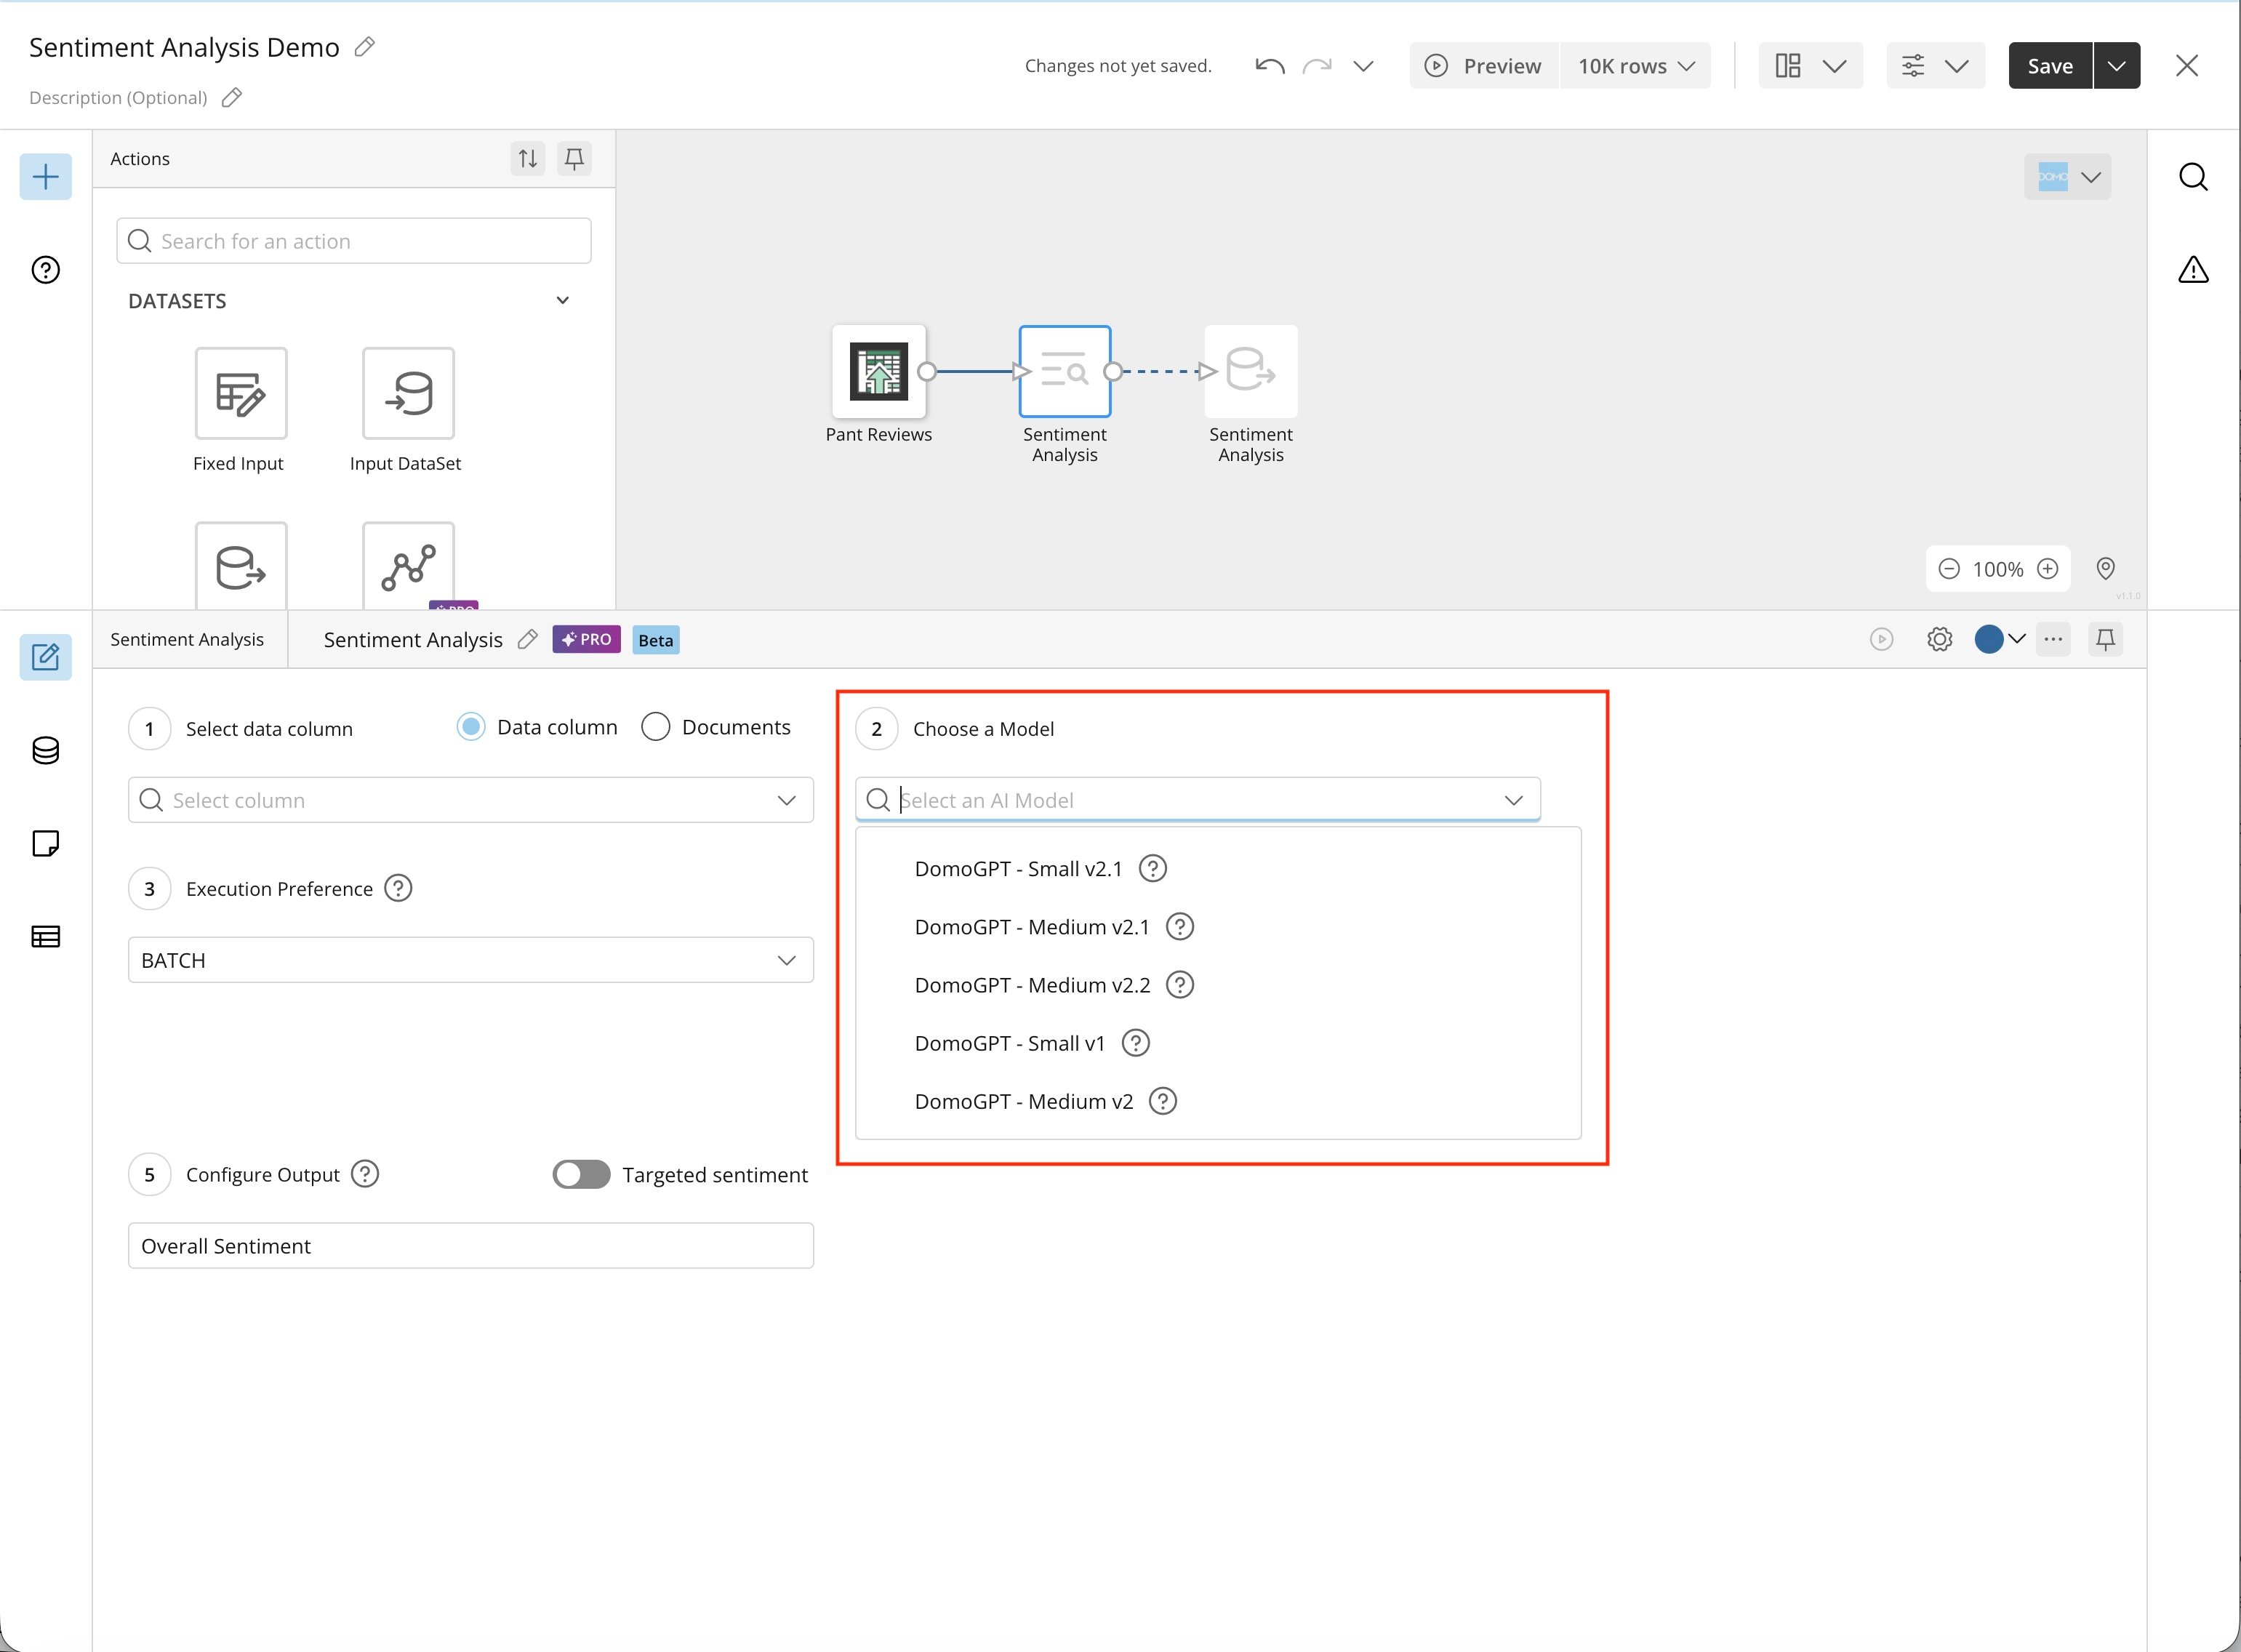
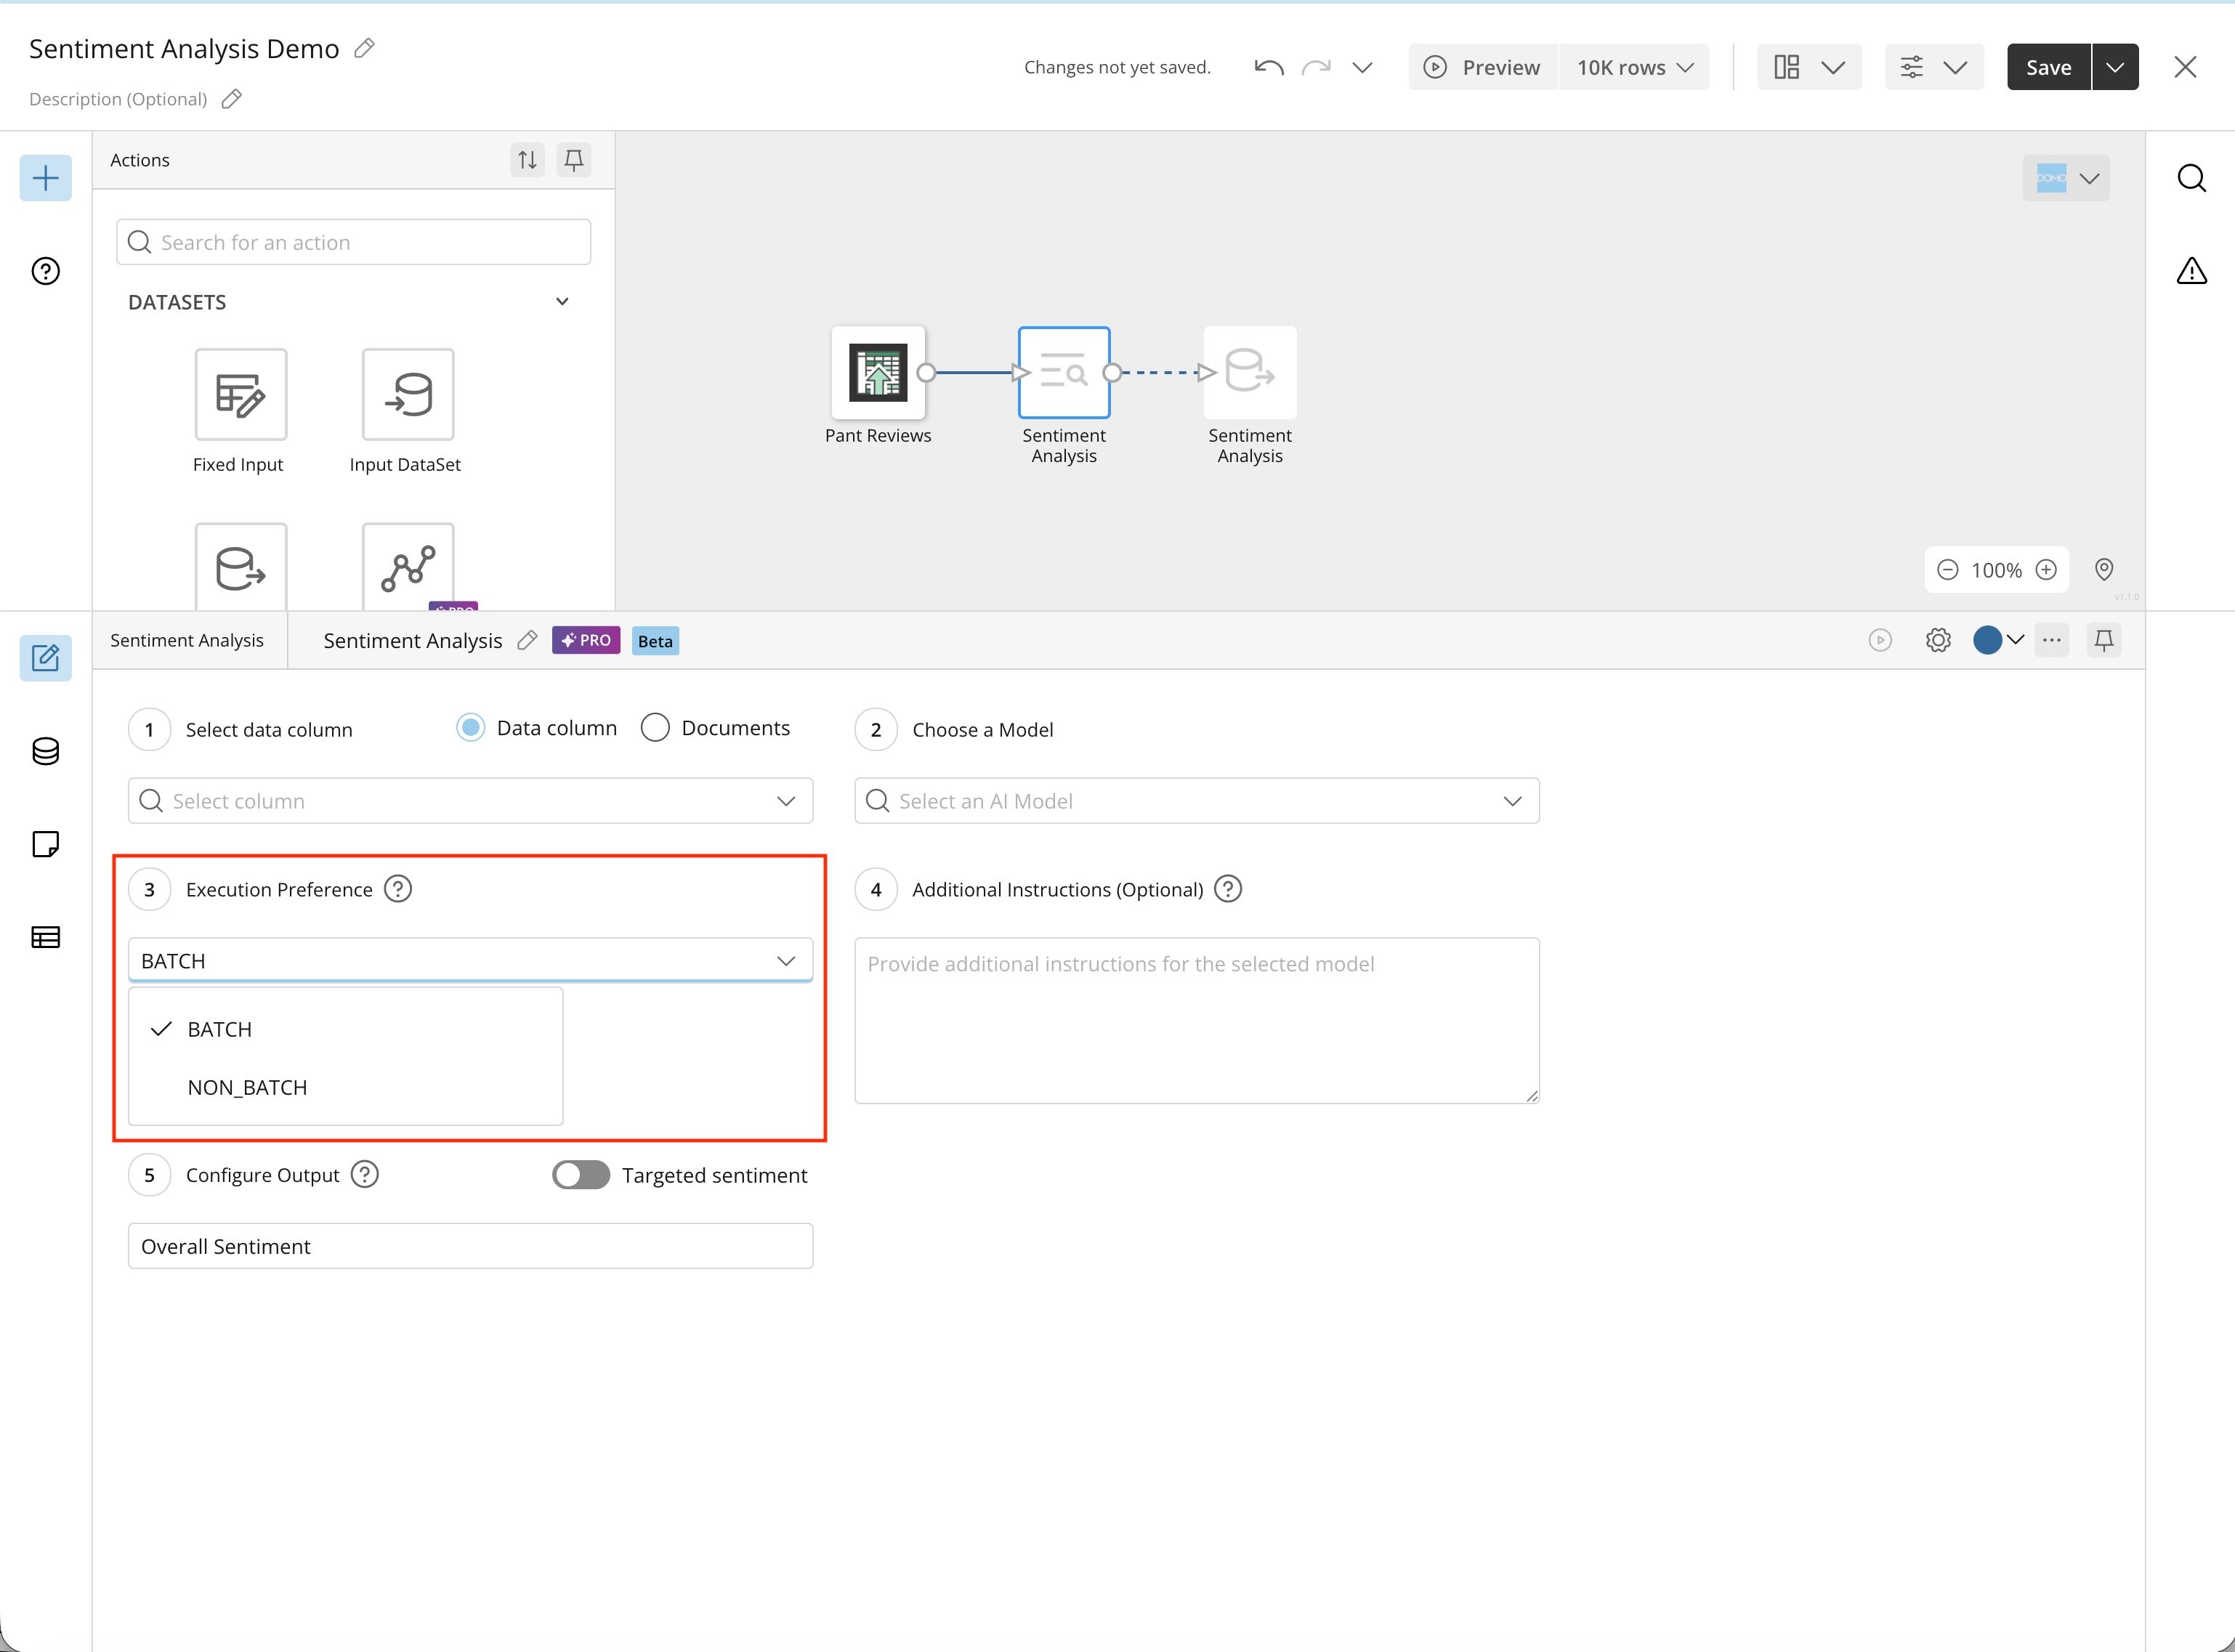
Note: Batch and non-batch processing differ primarily in latency, cost, and use case.Batch processing is designed for high-volume, asynchronous workloads, so execution times vary. It’s generally more cost-effective.Non-batch processing is intended for more consistent execution times with a small number of rows. Non-batch is always used when processing fewer than 100 rows of data.
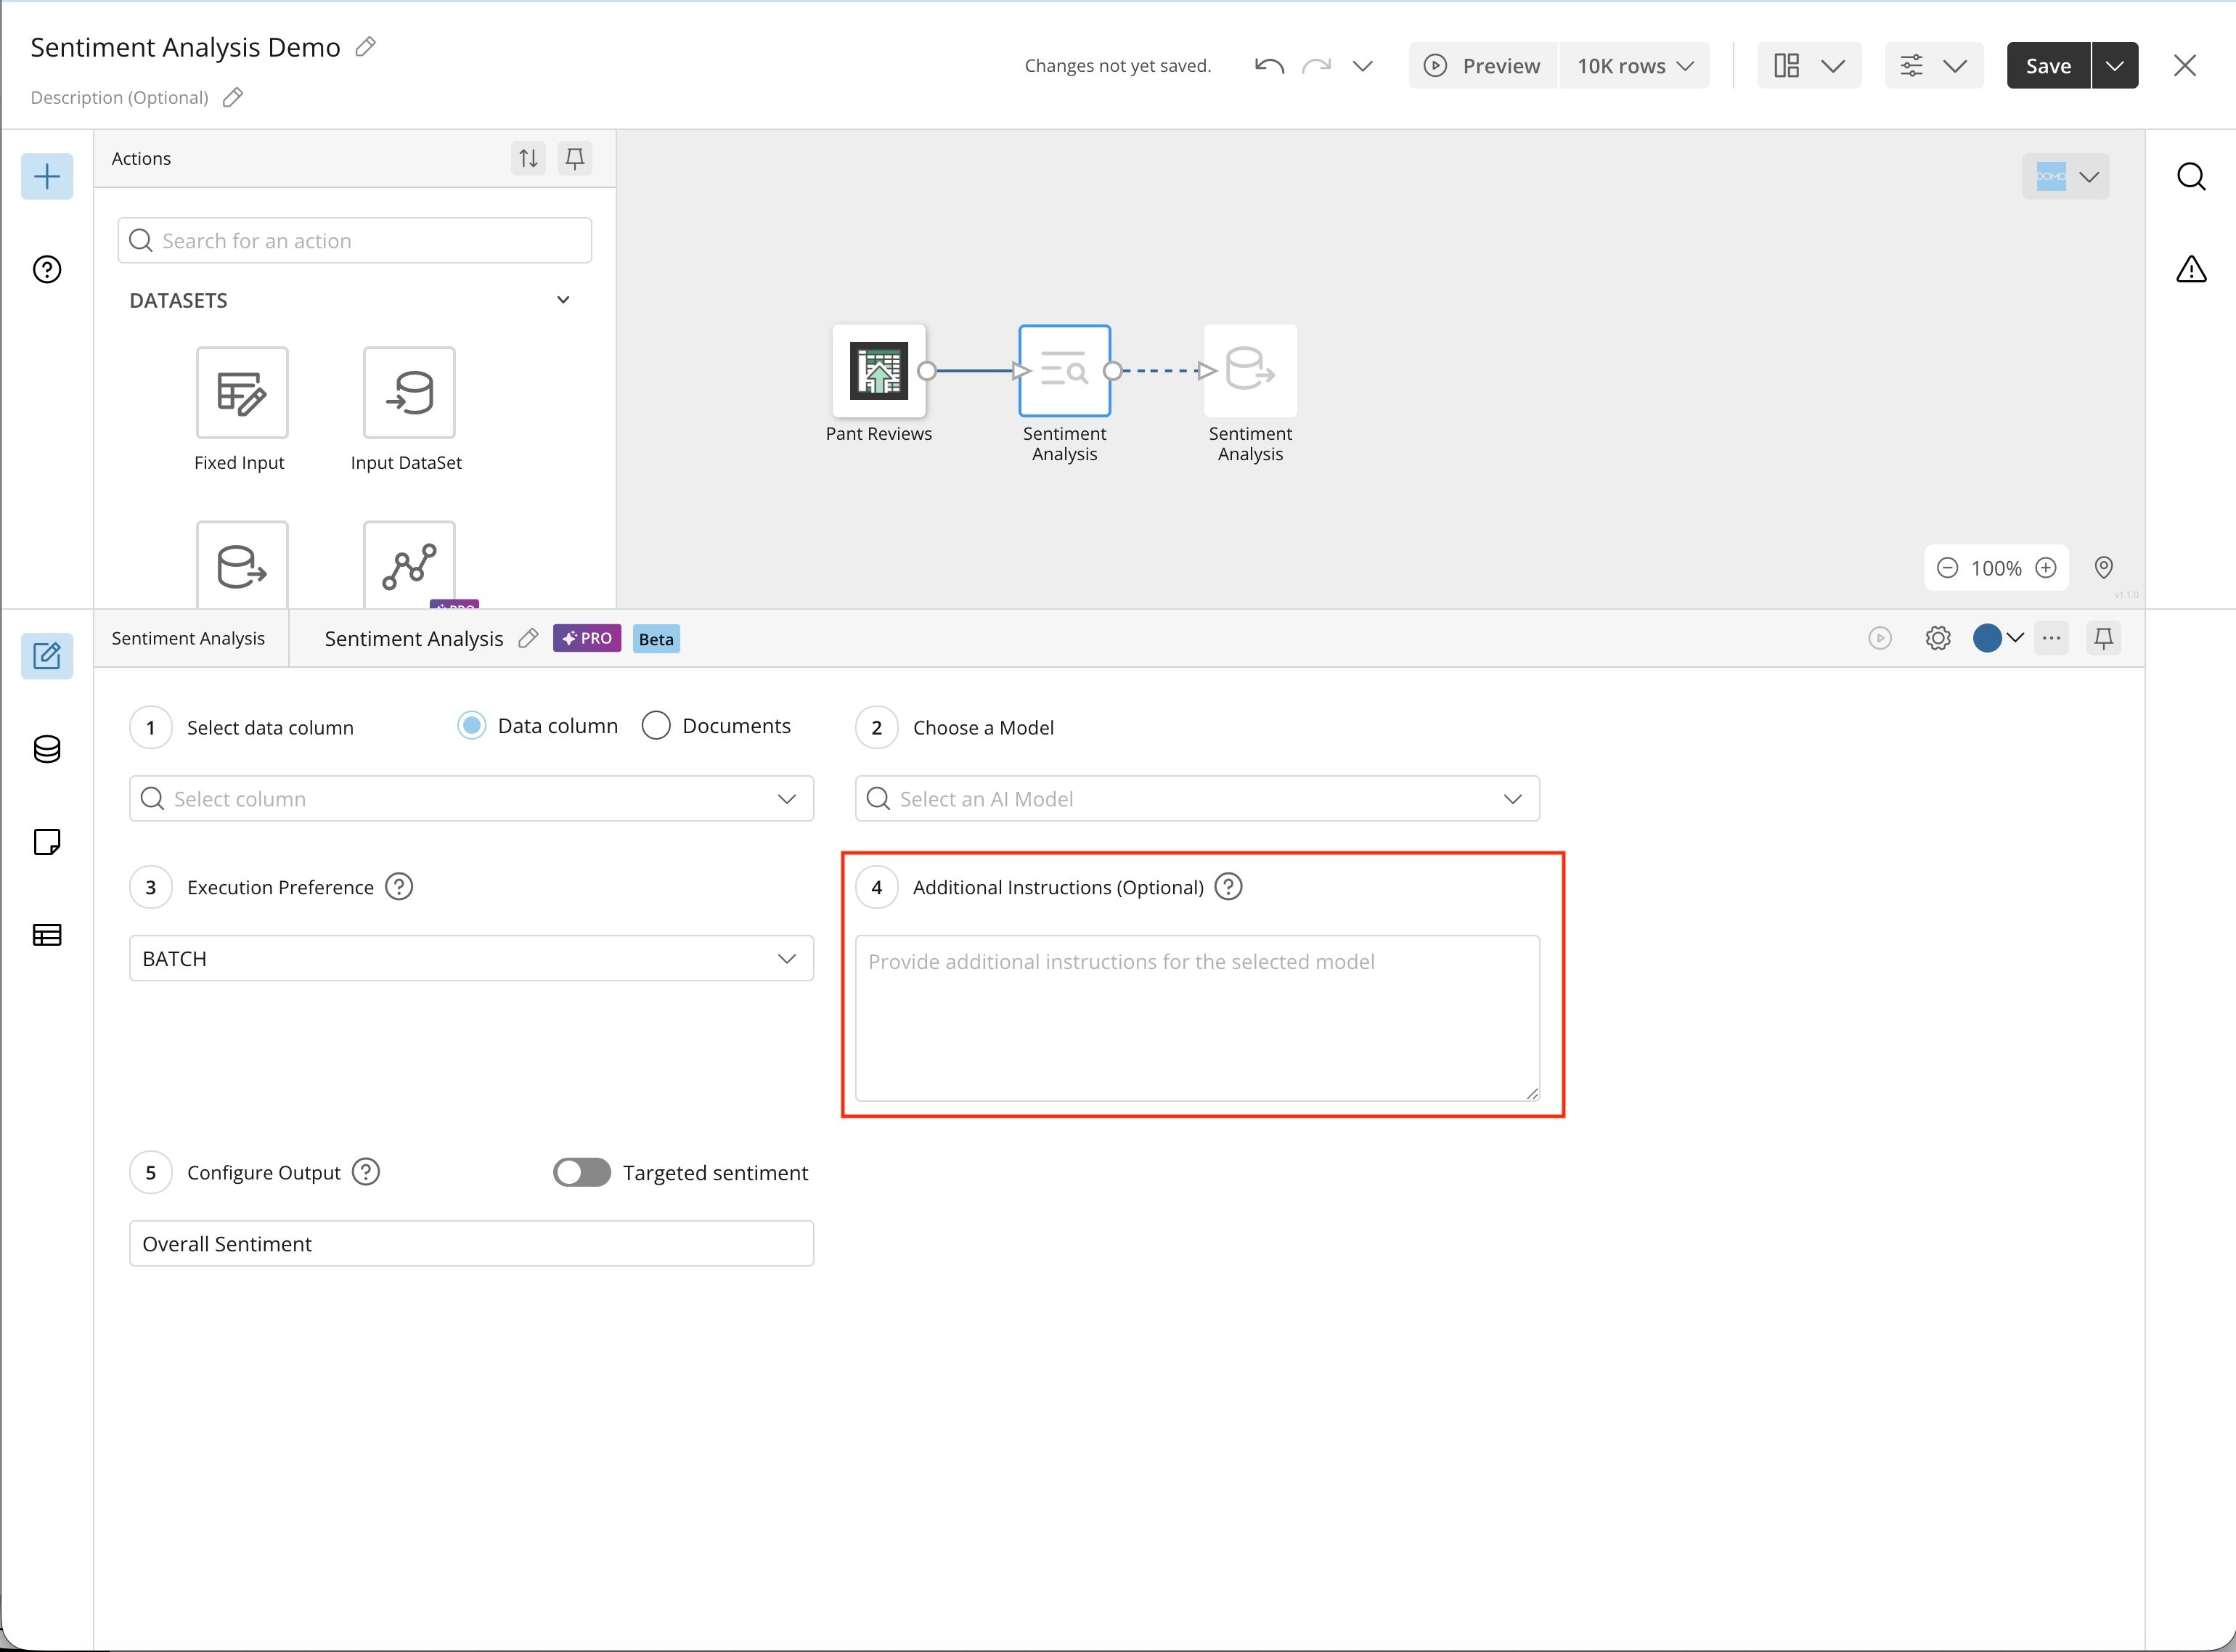
- Provide the model with any additional instructions on how to analyze the column. Be very specific; describe exactly what you want the model to do (and not to do).
-
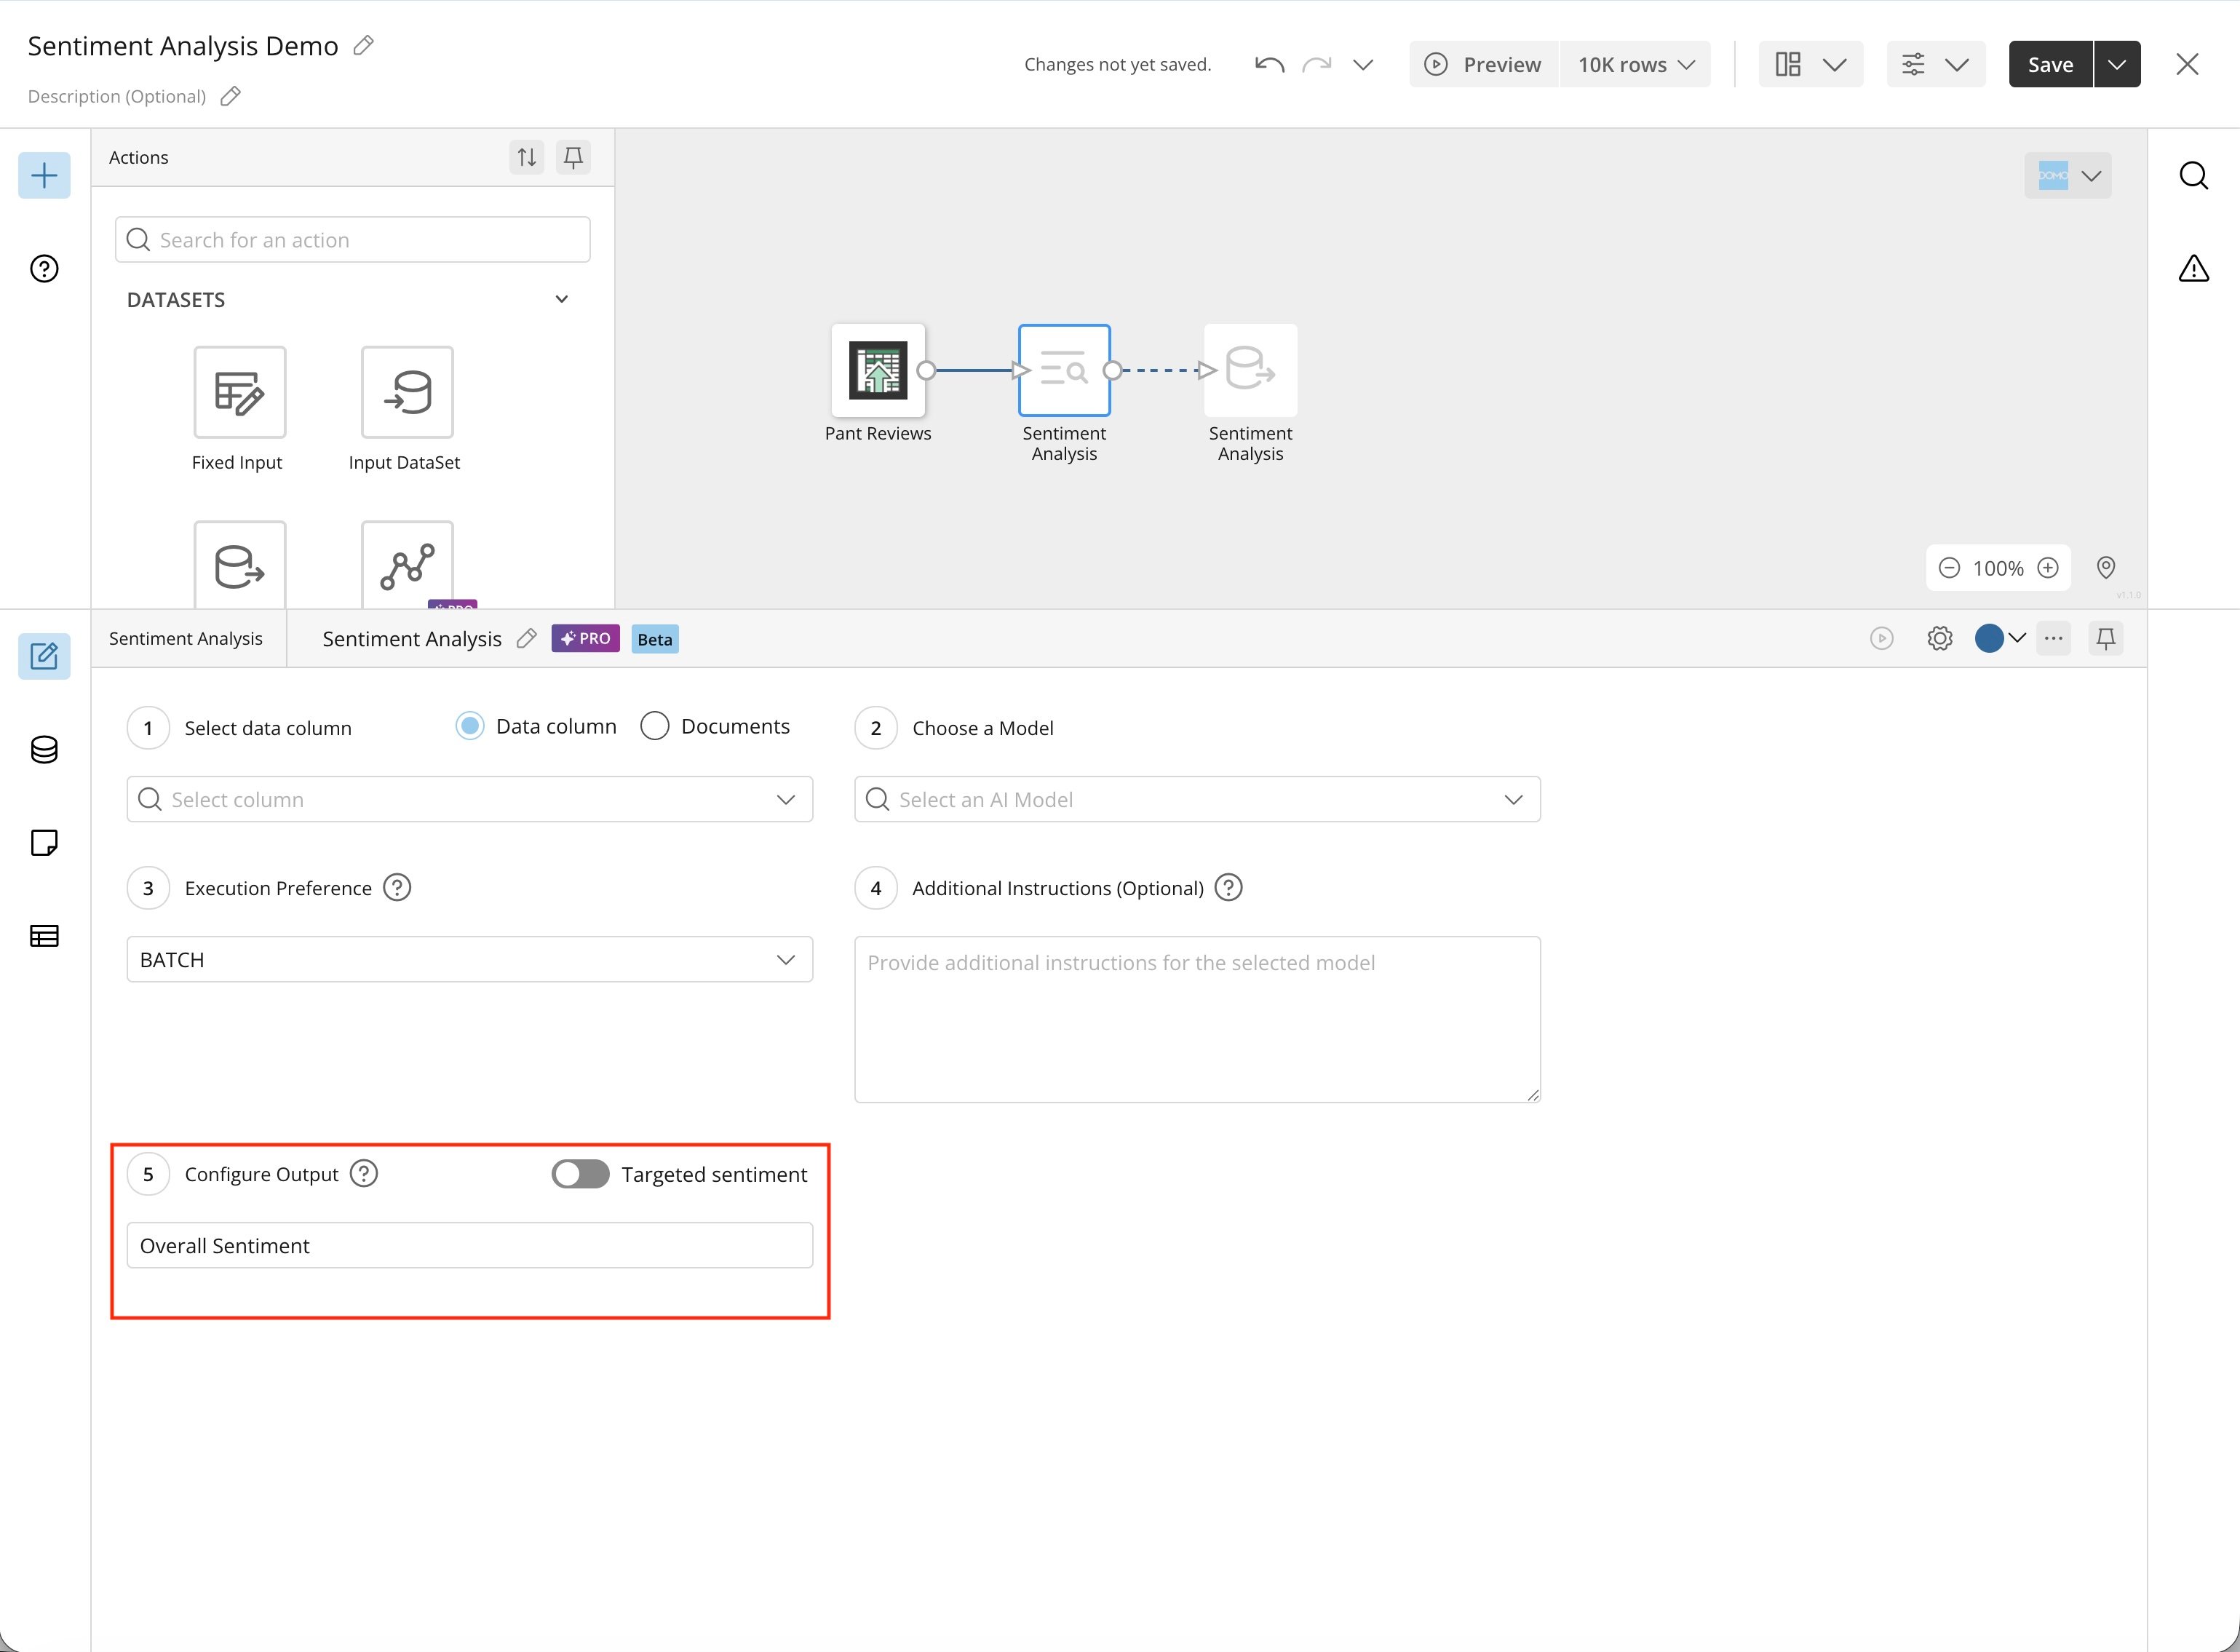
Overall Sentiment returns a single sentiment value for the text:
-
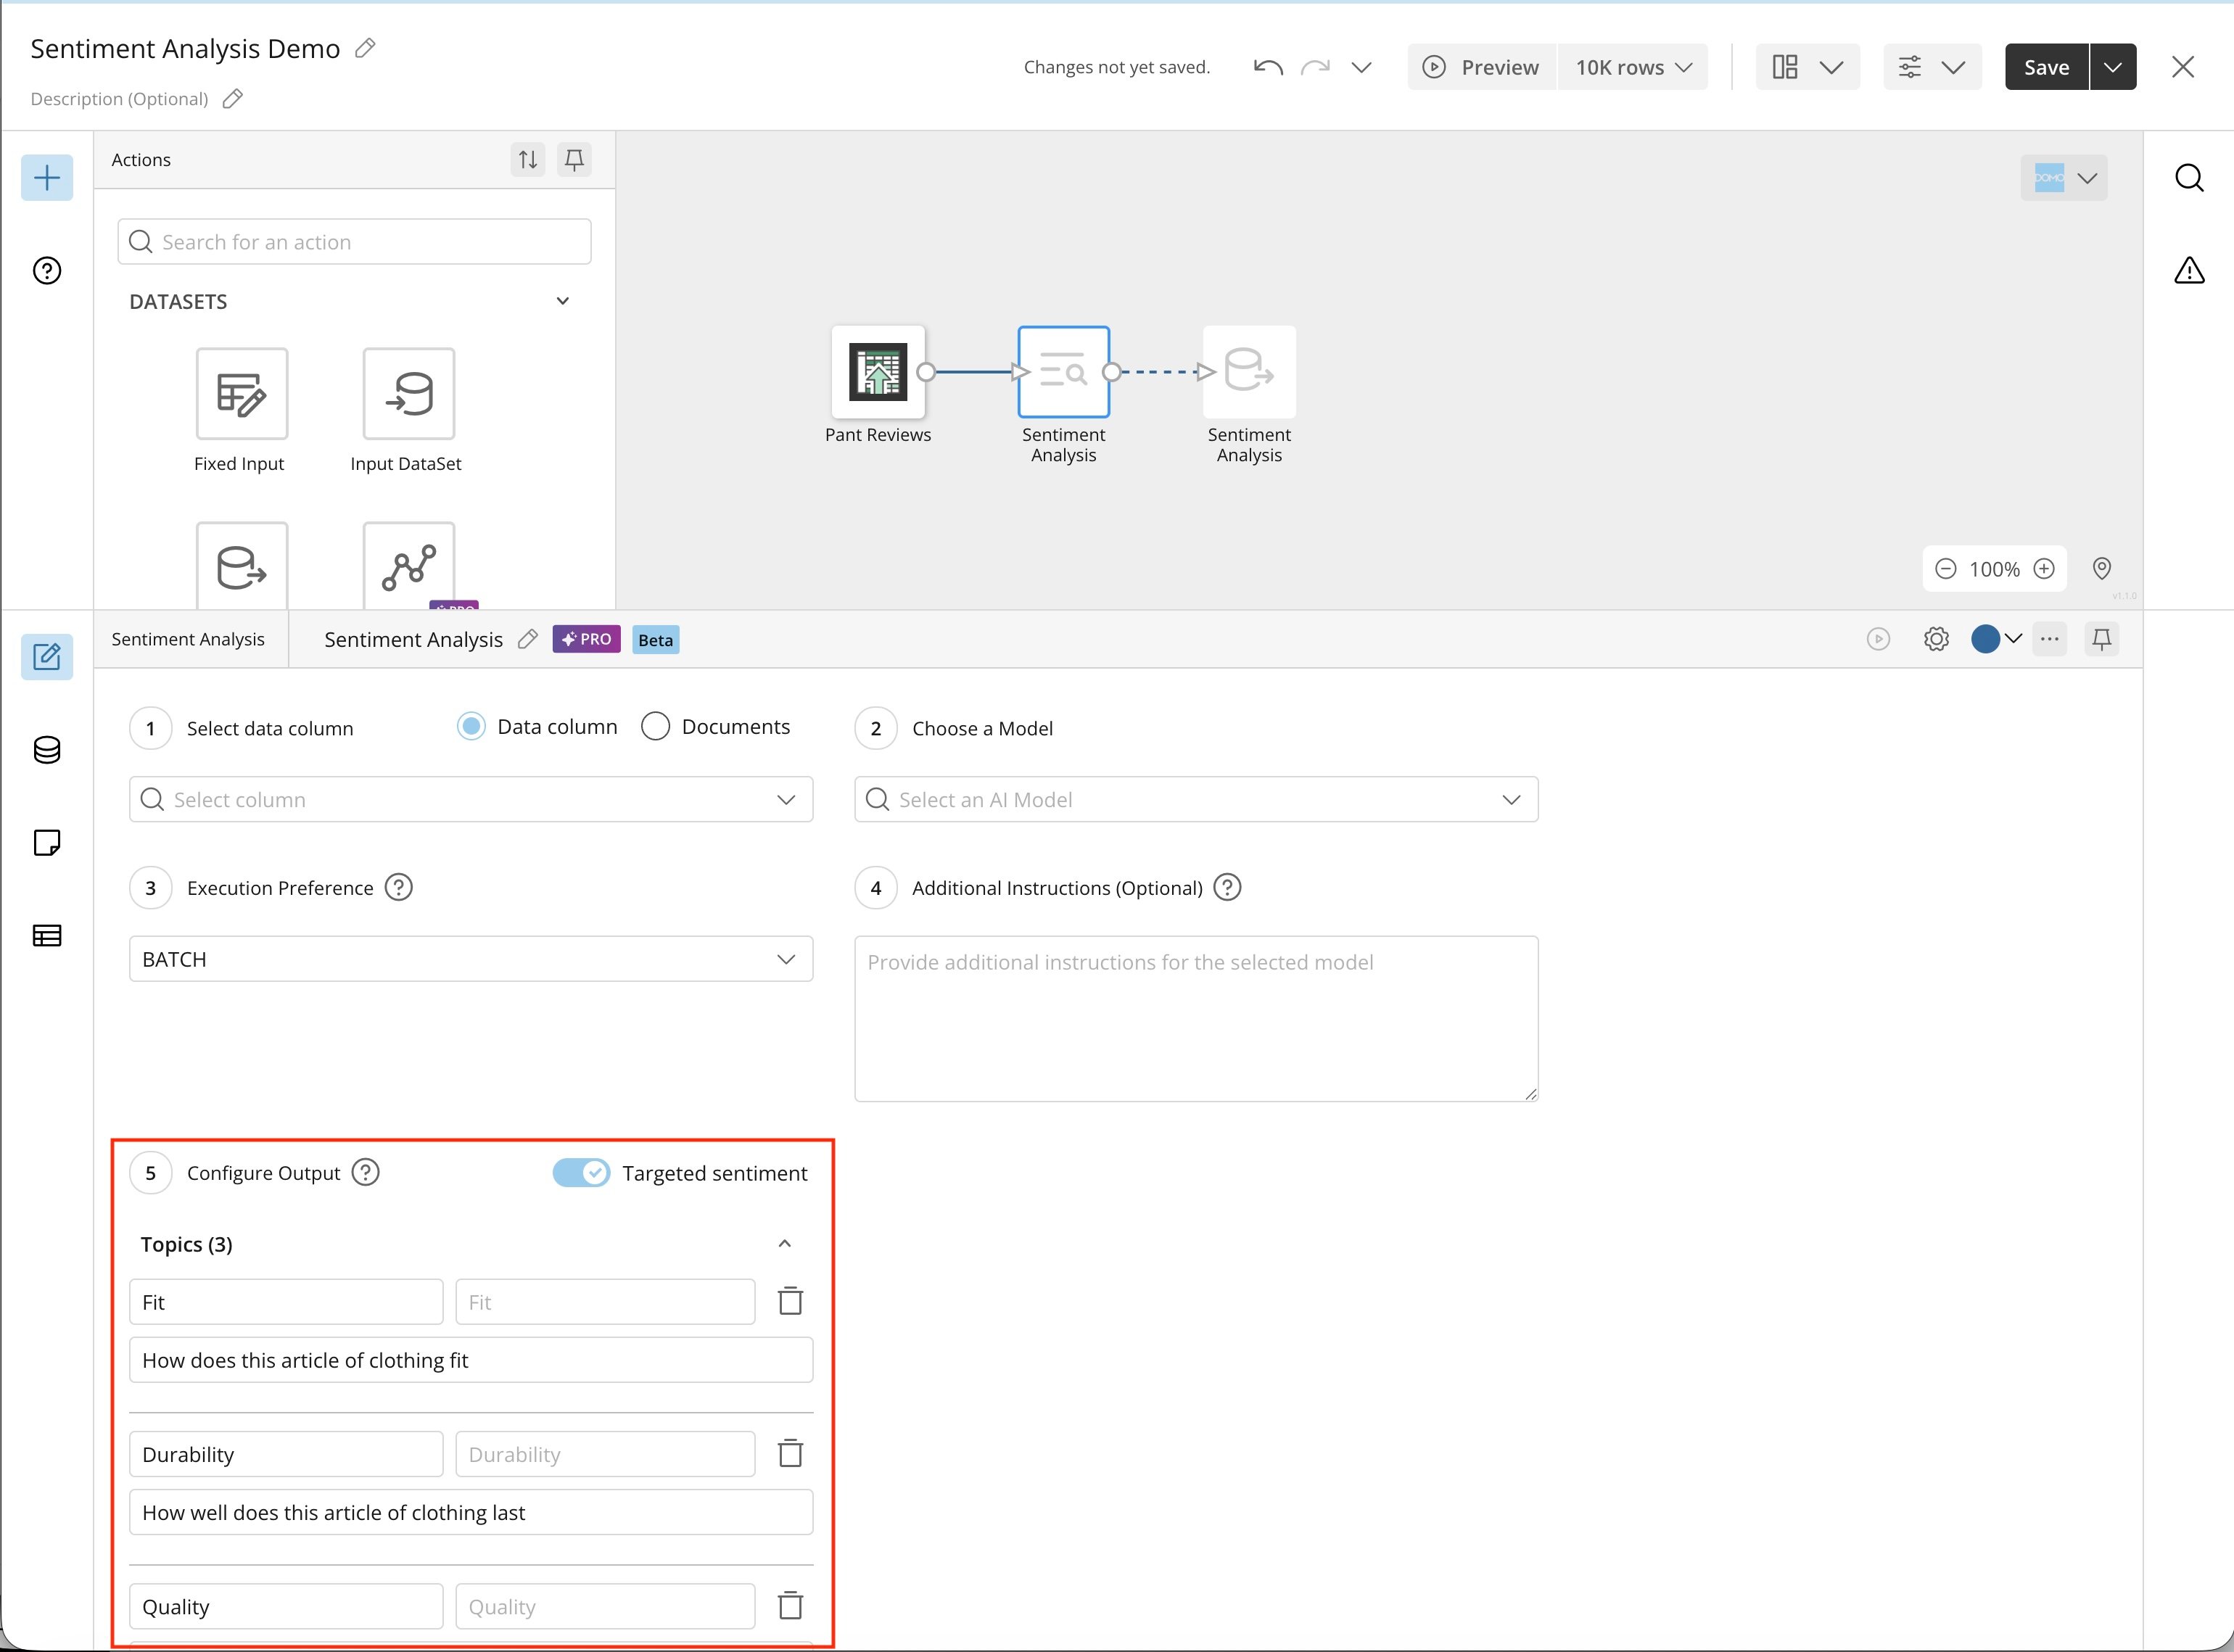
Targeted Sentiment returns a sentiment value for each topic you specify (for example, overall, fit, durability, and customer service):
- AI Operations: 1 operation per tile
- Tokens: input and output tokens vary based on the prompt and the data volume processed
- You can include multiple Sentiment Analysis tiles in the same DataFlow, tasking them with different aspects of analysis for the column (or analysis of different columns).
FAQ
Can I use my own model in the Sentiment Analysis tile?
Can I use my own model in the Sentiment Analysis tile?
Not currently, but this capability is on the roadmap.
Can you output multiple columns from a single Sentiment Analysis tile?
Can you output multiple columns from a single Sentiment Analysis tile?
Yes, you can enable Targeted Sentiment.